Hello @hement2 , and welcome to EnterpriseDNA and starting a conversation in the Community Forum.
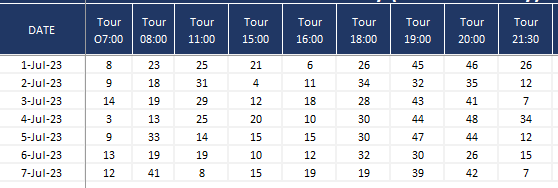
While we await a sample work-in-progress Power BI Desktop file, I thought that I would contribute some small help to the conversation. Without your sample file, I used a smaller data set to create the Report Visual similar to that which you asked in your question.
Things to remember:
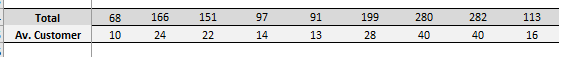
 The Report Visual is a Table, and you may add formatting to the table, and DAX measures if you choose.
Do note that the Average Row displayed is rounded to a whole number, though that can be adjusted by formatting the DAX if required.
 Please use the attached file as the logic in your development efforts.
 We look forward to your final solution. Good Luck!
customer tour report.pbix (53.2 KB)
Generic steps to add an average row to a report table using DAX using **UNION** and **ROW**
If you would like to add an average row to a table using DAX in Power BI, you can follow these steps:
1.1. Create a measure for the average values you want to display. For example, if you want to calculate the average of ‘Column2’ and ‘Column3’, you can use the following DAX expression:
AverageColumn2 = AVERAGE(YourTable[Column2])
AverageColumn3 = AVERAGE(YourTable[Column3])
Replace ‘YourTable’ with the name of your table.
1.2. Create a new table that includes the original table data along with the average row.
Use the UNION function in DAX to combine the two tables. Here’s an example:
UnionTable = UNION(VALUES(YourTable), ROW("Column1", "Average", "Column2", [AverageColumn2], "Column3", [AverageColumn3]))
This expression uses the VALUES function to retrieve all the distinct values from ‘YourTable’. Then, the ROW function is used to create a new row with the ‘Average’ label and the average values from the measures.
1.3. Display the UnionTable in a visual or use it for further analysis.
Please note that DAX is primarily used in Power BI and Excel Power Pivot for creating measures and calculations. DAX does not directly modify the structure of the underlying tables like SQL does with the UNION ALL function.
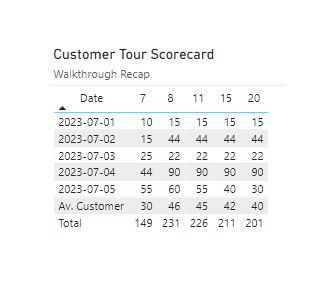
If you follow the logic in the Power BI Desktop file, you will see that I used the same pattern and extended the UNION to include an average and a total row.
The DAX measure for the resulting UNION Table is as follows:
Counts Table With Sum and Average =
UNION (
    VALUES ( tblCounts ),
    ROW (

        "Column1", "Total",
        "Column2", [SumColumn 07:00],
        "Column3", [SumColumn 08:00],
        "Column4", [SumColumn 11:00],
        "Column5", [SumColumn 15:00],
        "Column6", [SumColumn 20:00]

    ),
    ROW (

        "Column1", "Av. Customer",
        "Column2", [AverageColumn 07:00],
        "Column3", [AverageColumn 08:00],
        "Column4", [AverageColumn 11:00],
        "Column5", [AverageColumn 15:00],
        "Column6", [AverageColumn 20:00]


    )
)