My data begins with loading one or more csv files that are transformed to a single table of about 170K records. Not huge, but every step I add takes several minutes to perform and pegs out every CPU on my i7 processor. Are there some tricks out there to reduce the amount of time it takes to process queries?
Some questions that come to mind:
Are there many columns (Power Bi works better with a effective data model)
How much time does it in total?
Are you doing the transformations to each CSV file loading it (can you append it before transforming it?)?
What and how may transformations are you performing?
Are you loading all the CSV into the data model or just the single transformed table?
Hows your computers memory coping?
170k isn’t a lot of data in general so you shouldn’t be facing these problems really.
Thank you for your help. Please excuse anything I say that appears naïve - I’m still on a learning curve. I would include screen shots, but for some reason this response interface has no option for pictures…
I’ve created a template with a parameter (FilesPath) to prompt the user for a folder path. The query creates a table of qualifying csv files located in the folder path and stores then in binary format
let
    Source = Folder.Contents(FilesPath),
    #"Filtered Rows" = Table.SelectRows(Source, each Text.StartsWith([Name], "Power") and [Extension] = ".csv"),
    Navigation1 = #"Filtered Rows"{0}[Content]
in
    Navigation1
From here, I can view a table of the files (not the data) with a Content column where each record is ‘binary’ - I presume being the binary representation of the data. At the top of this column is a double down arrow button (tooltip: Combine Files). Pressing it causes PowerBI to ‘transform’ the files and create a Transform File function that is automatically run when the PowerBI is opened as a template(pbit file). So the ‘transformation’ I’m talking about transforms from binary data with a function created by PowerBI that automatically combines the files (appends) into a query.
The query has 47 columns - which I’m stuck with for now because they come from a source beyond my control.
I then run a number of steps - including adding a couple of calculated columns with simple multiplication, renaming, sorting and adding an index.
I also create 5 other query’s using reference from the main query. They have 1 to six columns in them. This appears to be where everything slows down - to about 7 minutes when I refresh (which can be invoked by clicking on them). When refresh occurs It appears PowerBI is going out to the original csv files (3 of them now - but could be up to 5) on disk as I watch the original file names cycle through loading processes in the lower right corner of the screen. I think it’s doing it for all 6 queries.
I used TSQL for a while several years ago and I do a lot with Excel, so what I’m doing feels rather light duty - but obviously it’s not - so I figure there must be something I’m doing wrong, or not doing at all that could speed things up.
Open to any suggestions. Thank you.
Yep great, all good suggestions that make a bit difference
Hi Rob, that’s odd you can’t add pictures, you should be able to just like your other post? Can you advise on the error so I can investigate. Thanks
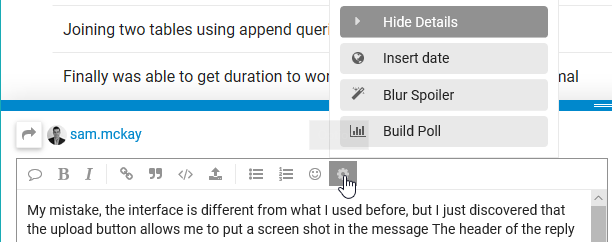
My mistake, the interface is different from what I used before, but I just discovered that the upload button allows me to put a screen shot in the message. Here’s a screen shot of the options here:
You should just be able to copy and paste into any post. That’s what I do. Potentially its just a settings thing, I’m not sure right at this moment
After reading through this a couple of times, to me it doesn’t seem like your queries should be taking anywhere near that long.
It is always tough with these as there are a number of factors at play that are always difficult to understand without seeing everything and also testing.
Couple of things stick out that may be causing problems.
With your 47 columns can you delete some of these once you have queried them. My bet is you do not actually need them all for the analysis you may be doing.
I’m not sure you would need to create any numeric calculated columns. (esepcially inside the query editor if that’s where they are being created in this case). All calculation should primarily be happening within DAX measures. It’s way way more optimal to do this.
Also when referencing the main query, what are you doing with these. Are you breaking things up into lookup tables?
Do you need to also be querying all the csv files everytime? Is the data updating constantly in these, that they all need to be re-loading everytime?
Overall this to me does seem light duty as you mentioned here.
It’s likely that there’s some transformations here that just aren’t required.
That about all I can offer right now.
If you can post more images some how that would be great (let’s try to sort this issue out)
Not sure if you’ve gone through this course module yet, but all best practice tips on the query editor are contained in here.
Highly recommend diving into this one when you can.
Chrs
Sam
1 Like
I really appreciate your help on all this. The other queries divided the data into logical groups as shown below with just a few columns each (State is “Condition State” - not US State). Calculations were limited to a couple core values. They were all connected with a common one to one relationship back to my main table - which I was planning to remove once I had my reporting figured out based on the other tables. Metrics is devoted to DAX measures. I initially thought this would be a good way to structure my data, but the overhead has proved too burdensome. So now I’ve abandoned that approach

There are other ways I could divide my data into related tables, but I’m seeing little value to be gained - so I’ve since removed all but Metrics and adjusted my measures and visuals accordingly. However, I’m going to review everything you’ve sent as I suspect there’s stuff I need to learn to be effective at this! (Perhaps some data transformation is key here  )
)
Regarding the forum interface…
Yes, I see copy/paste works for me too. What’s weird is that up until yesterday I was presented with an interface with a blue photo button that I used to paste my screen shots. Being a newbie, I was momentarily ‘lost’ when presented with the alternative interface, but now I’m fine with it. The only correlation I can make is that the interface seemed to change when I “Earned Basic” … just a hunch.
Ok cool I think your on the right track breaking out the details into lookup tables.
BUT - please work through this course when you can. There still a lot around the structure of the model and also the relationships you have there.
Once you get things setup well here you’ll be amazed at how much more intuitive everything else will be
Also you want to look at creating measure groups for you measures.
See below.
The idea with creating a ‘model’ of your data is to really optimize your tables as much as you can.
For example if you are breaking out these tables then you main fact table should be very thin (hardly any columns). This will immediately reduce the amount of data you have in your model.
Also think a lot about what is a fact table and what is a lookup table. For example Costs/Costs6 - should these really be two tables…honestly I doubt it here.
In conclusion I think what you’re trying to do here mostly is pretty stock standard and should not be taken a long amount of time to update.
I think following a few best practices here and cleaning things up will make a huge difference and simplify things immensely as you move forward with the model.
See if you can find the time to work through this one module, you’ll really enjoy I suspect.
Chrs
Sam
What would be the reason for the many-to-many relationships in the diagram?? Won’t this lead to some confusion in the long run??
Just trying to follow along and understand everything.
![]()
They are one to one relationships - but yes, little basis beyond data organization. I’m changing the whole structure now.
I apologize I miss-read the diagram
![]()
So I’ve done my own investigation into this matter and found that the performance issues I was experiencing were two-fold:
- I was performing a 3 level sort in power query on my fat table to create an index column in a preferred order
- I was using Reference in Power Query to create my look-up tables
Furthermore, my data comes from multiple csv files on disk - no SQL option in this case. (I have fast hard drives, great hardware overall, but not as fast as memory!)
The first step in my fat table query combines 2 or more csv files (with exact same data structure) into one query. This step doesn’t seem too time consuming. Neither do other steps (column naming and data type changes). it’s the sorting that kills it!
As a newbie I thought that referencing my fat table to create my look up tables would save time - thinking it would only have to go through the initial query steps once. But I am mistaken. While I don’t understand why, each referenced table causes PowerBI to repeat the same steps from the main (fat) table each time - so that sorting step adds an enormous amount of time that gets repeated for every lookup table!
Eliminating the sorting step (I really don’t need that index column) and reducing the number lookup tables makes a significant difference.
But questions remain.
-
Why does the Reference option have to repeat the steps of the referenced query? What is more efficient, Reference or Duplicate? When should one method be used over the other?
-
Seems that sorting should be avoided whenever possible in Power Query. Indeed, with a good data model, there should be no need for it. Do you agree? Why does sorting take so long?
-
Thinking now that it may be better to create my look-up tables in DAX. Do you agree?
What you should do here in this specific example is instead of using reference,
Is to use duplicate...before you complete any sorting. You’ll see that duplicate will replicate everything within your query up to the point when you duplicate it.
This way you can separate out the sorting and complete this on a far more optimized table.
Totally agree on the sorting issue. A good data model should solve for this. I would need to understand more about this index column though. I’m not sure exactly what you’re looking at so hard to say or why you intially thought you needed it and now don’t?
Breaking out you model into lookup table should be done in the query editor. This should be a simple solution so I’m still not 100% sure why it should take that long still.
You can do it in DAX, but if you can complete it in the query editor first I would.
Chrs
Sam