Hi all,
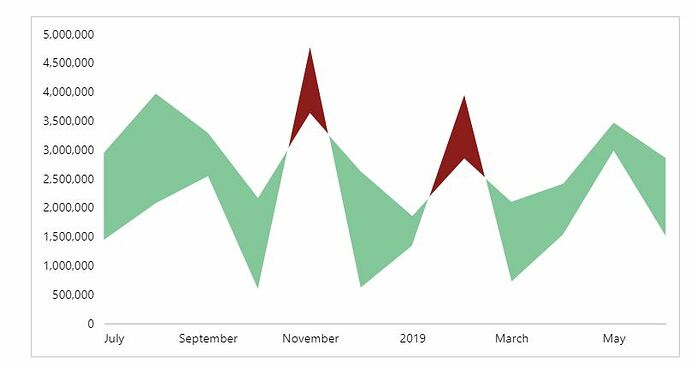
I’m trying to recreate the “hills and valleys” by Daniel Marsh-Patrick posted here:
The coding is a bit above my level but it would be great if I could get the chart to work.
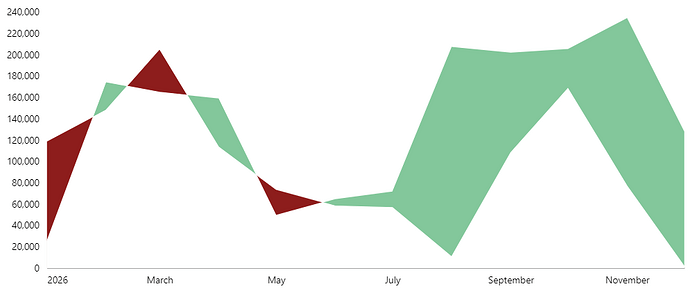
The expected output is like this:
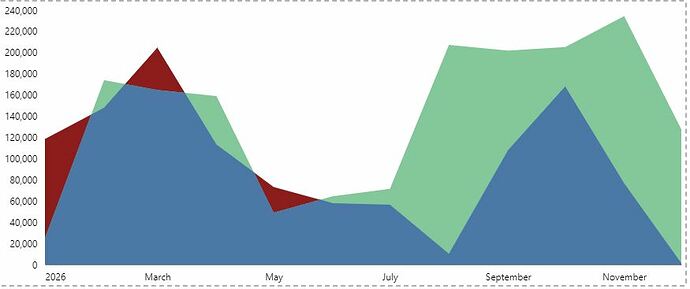
I’m nearly there, just need to get rid of the blue sections:
The source data I’m using is different to Daniel’s so that’s why the shape of the chart is different.
My PBI file is here:
Error Bands.pbix (3.5 MB)
My JSON code is:
{
“data”: {“name”: “dataset”},
“encoding”: {
“x”: {
“field”: “Month”,
“type”: “temporal”
},
“y”: {“type”: “quantitative”}
},
“layer”: [
{
“description”: “Target area - background”,
“mark”: {
“type”: “area”,
“style”: “delta_negative”
},
“encoding”: {
“y”: {“field”: “Sales PY”}
}
},
{
“description”: “Actual area - masks out target where necessary”,
“mark”: {
“type”: “area”,
“style”: “delta_positive”
},
“encoding”: {
“y”: {“field”: “Sales”}
}
},
{
“description”: “Masking layer (with interpolated points)”,
“transform”: [
{
“calculate”: “min(datum[‘Sales PY’] , datum[‘Sales’])”,
“as”: “low_value”
},
{
“window”: [
{
“op”: “lead”,
“field”: “Month”,
“as”: “month_following”
},
{
“op”: “lead”,
“field”: “Sales”,
“as”: “actual_following”
},
{
“op”: “lead”,
“field”: “Sales PY”,
“as”: “target_following”
}
]
},
{
“calculate”: “(datum[‘actual_following’] - datum[‘Sales’]) / (datum[‘month_following’] - datum[‘Month’])”,
“as”: “actual_slope”
},
{
“calculate”: “(datum[‘target_following’] - datum[‘Sales PY’]) / (datum[‘month_following’] - datum[‘Month’])”,
“as”: “target_slope”
},
{
“calculate”: “datum[‘Sales’] - (datum[‘actual_slope’] * datum[‘Month’])”,
“as”: “actual_y_intercept”
},
{
“calculate”: “datum[‘Sales PY’] - (datum[‘target_slope’] * datum[‘Month’])”,
“as”: “target_y_intercept”
},
{
“calculate”: “(datum[‘target_y_intercept’] - datum[‘actual_y_intercept’]) / (datum[‘actual_slope’] - datum[‘target_slope’])”,
“as”: “intersect_base”
},
{
“calculate”: “datum[‘intersect_base’] > datum[‘Month’] && datum[‘intersect_base’] < datum[‘month_following’]”,
“as”: “intersect_before_following”
},
{
“calculate”: “datum[‘intersect_before_following’] ? datetime(datum[‘intersect_base’]) : null”,
“as”: “intersect_x”
},
{
“calculate”: “datum[‘intersect_before_following’] ? (datum[‘actual_slope’] * datum[‘intersect_base’]) + datum[‘actual_y_intercept’] : null”,
“as”: “intersect_y”
},
{
“fold”: [
“Month”,
“intersect_x”
]
},
{
“filter”: “datum[‘value’] !== null”
},
{
“calculate”: “datum[‘key’] === ‘Month’ ? datum[‘Month’] : datum[‘intersect_x’]”,
“as”: “x”
},
{
“calculate”: “datum[‘key’] === ‘Month’ ? datum[‘low_value’] : datum[‘intersect_y’]”,
“as”: “y”
}
],
“mark”: {
“type”: “area”,
“style”: “mask_foreground”
},
“encoding”: {
“x”: {“field”: “x”},
“y”: {“field”: “y”}
}
}
]
}
Many thanks,
Tim


