Hi all,
I’m trying to extend the “hills and valleys” visual by Daniel Marsh-Patrick posted here:
https://coacervo.co/deneb_hill_valley
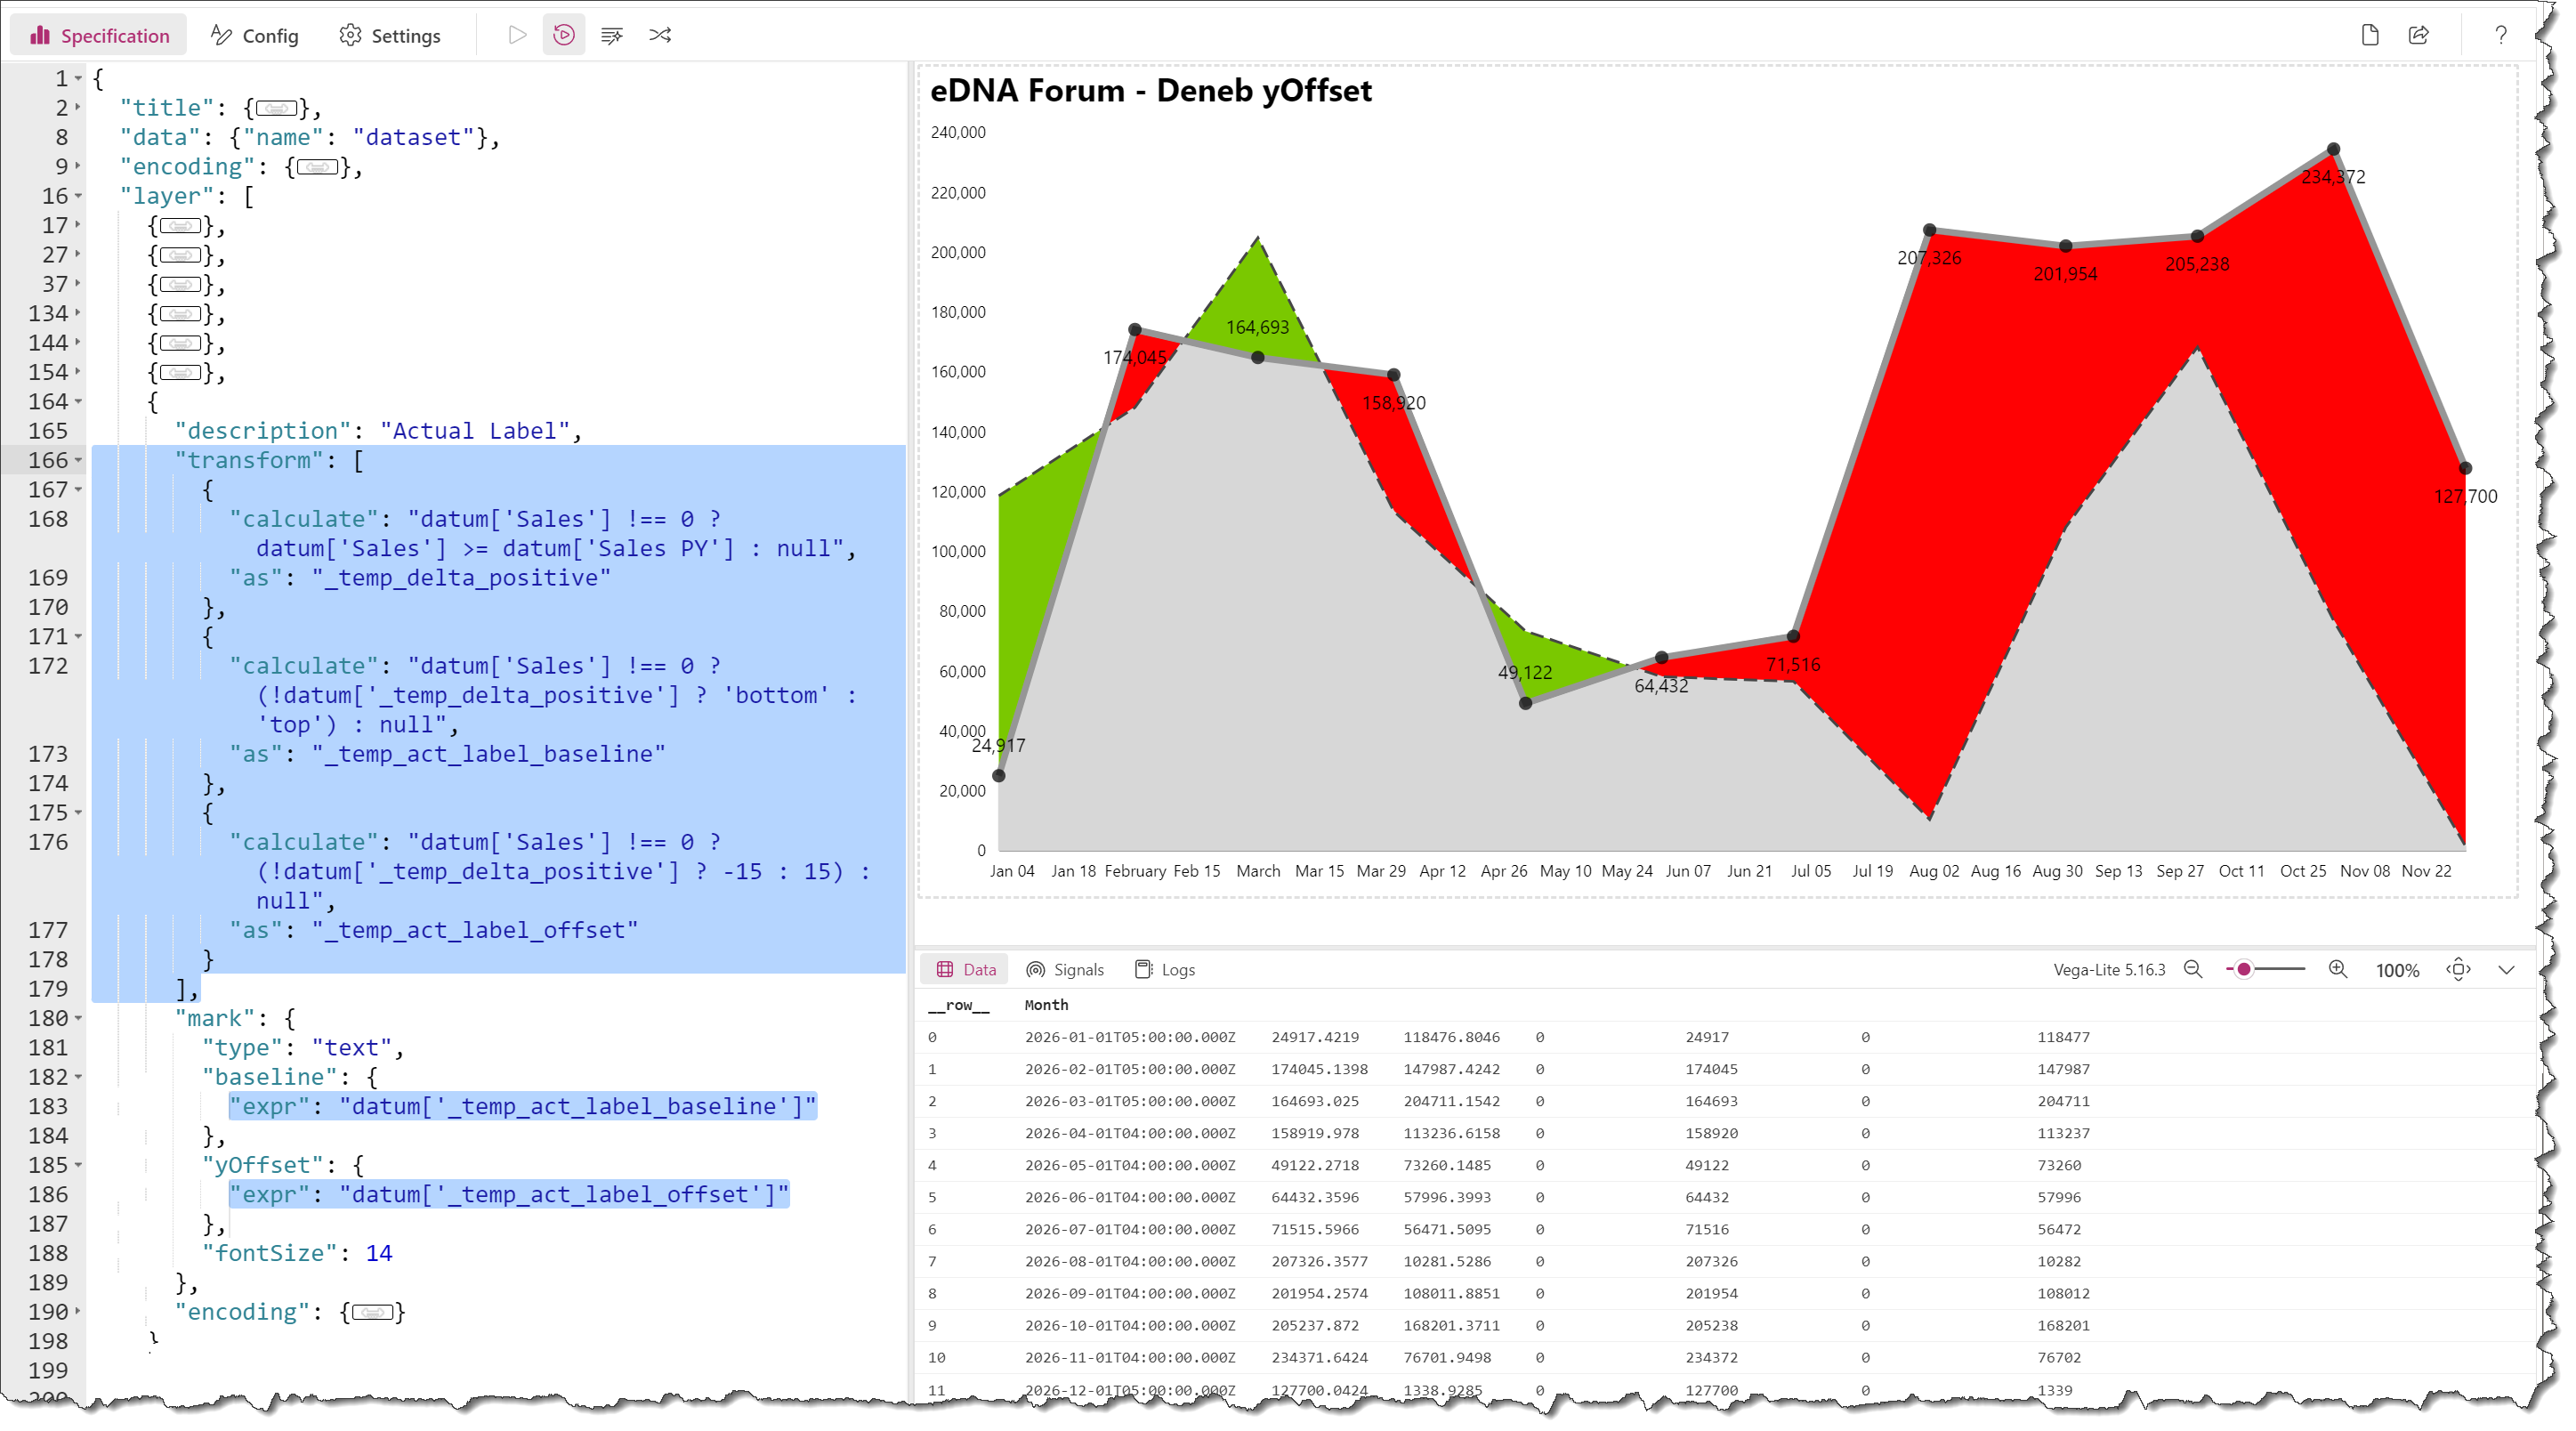
It is already looking pretty promising but I would like to add the data labels to the chart, depending on an calculated offset value.
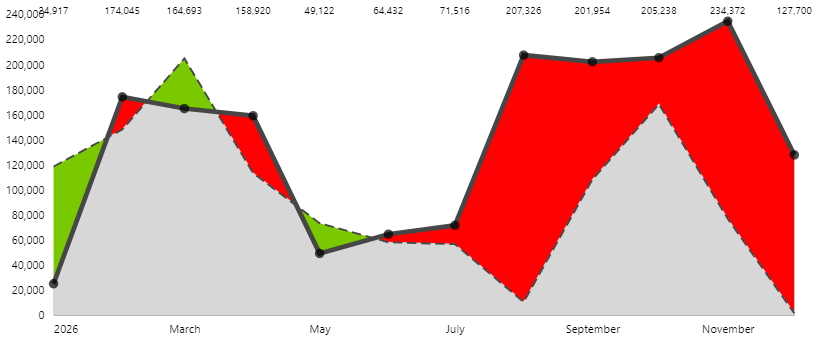
I’m able to display the values but I’m it looks like the offset value gets incorrectly interpreted and I’m stuck on how to fix it.
If I replace:
        "yOffset": {
          "expr": "datum['act_label_offset']"
        }
with a fixed value, it is working, but I need this to be dynamic.
My file can be found here:
Custom Hills and Valley.pbix (3.5 MB)
My code is:
{
  "data": {"name": "dataset"},
  "encoding": {
    "x": {
      "field": "Month",
      "type": "temporal"
    },
    "y": {"type": "quantitative"}
  },
  "layer": [
    {
      "description": "Target area - background",
      "mark": {
        "type": "area",
        "style": "delta_negative"
      },
      "encoding": {
        "y": {"field": "Sales PY"}
      }
    },
    {
      "description": "Actual area - masks out target where necessary",
      "mark": {
        "type": "area",
        "style": "delta_positive"
      },
      "encoding": {
        "y": {"field": "Sales"}
      }
    },
    {
      "description": "Masking layer (with interpolated points)",
      "transform": [
        {
          "calculate": "min(datum['Sales PY'] , datum['Sales'])",
          "as": "low_value"
        },
        {
          "window": [
            {
              "op": "lead",
              "field": "Month",
              "as": "month_following"
            },
            {
              "op": "lead",
              "field": "Sales",
              "as": "actual_following"
            },
            {
              "op": "lead",
              "field": "Sales PY",
              "as": "target_following"
            }
          ]
        },
        {
          "calculate": "(datum['actual_following'] - datum['Sales']) / (datum['month_following'] - datum['Month'])",
          "as": "actual_slope"
        },
        {
          "calculate": "(datum['target_following'] - datum['Sales PY']) / (datum['month_following'] - datum['Month'])",
          "as": "target_slope"
        },
        {
          "calculate": "datum['Sales'] - (datum['actual_slope'] * datum['Month'])",
          "as": "actual_y_intercept"
        },
        {
          "calculate": "datum['Sales PY'] - (datum['target_slope'] * datum['Month'])",
          "as": "target_y_intercept"
        },
        {
          "calculate": "(datum['target_y_intercept'] - datum['actual_y_intercept']) / (datum['actual_slope'] - datum['target_slope'])",
          "as": "intersect_base"
        },
        {
          "calculate": "datum['intersect_base'] > datum['Month'] && datum['intersect_base'] < datum['month_following']",
          "as": "intersect_before_following"
        },
        {
          "calculate": "datum['intersect_before_following'] ? datetime(datum['intersect_base']) : null",
          "as": "intersect_x"
        },
        {
          "calculate": "datum['intersect_before_following'] ? (datum['actual_slope'] * datum['intersect_base']) + datum['actual_y_intercept'] : null",
          "as": "intersect_y"
        },
        {
          "calculate": "datum['Sales'] !== 0 ? datum['Sales'] >= datum['Sales PY'] : null",
          "as": "delta_positive"
        },
        {
          "calculate": "datum['Sales'] !== 0 ? (!datum['delta_positive'] ? 'bottom' : 'top') : null",
          "as": "act_label_baseline"
        },
        {
          "calculate": "datum['Sales'] !== 0 ? (!datum['delta_positive'] ? -15 : 15) : null",
          "as": "act_label_offset"
        },
        {
          "fold": [
            "Month",
            "intersect_x"
          ]
        },
        {
          "filter": "datum['value'] !== null"
        },
        {
          "calculate": "datum['key'] === 'Month' ? datum['Month'] : datum['intersect_x']",
          "as": "x"
        },
        {
          "calculate": "datum['key'] === 'Month' ? datum['low_value'] : datum['intersect_y']",
          "as": "y"
        }
      ],
      "mark": {
        "type": "area",
        "style": "mask_foreground"
      },
      "encoding": {
        "x": {"field": "x"},
        "y": {"field": "y"}
      }
    },
    {
      "description": "PY Line",
      "mark": {
        "type": "line",
        "style": "py_line"
      },
      "encoding": {
        "y": {"field": "Sales PY"}
      }
    },
    {
      "description": "Actual Line",
      "mark": {
        "type": "line",
        "style": "actual_line"
      },
      "encoding": {
        "y": {"field": "Sales"}
      }
    },
    {
      "description": "Actual Dots",
      "mark": {
        "type": "point",
        "style": "actual_dots"
      },
      "encoding": {
        "y": {"field": "Sales"}
      }
    },
    {
      "description": "Actual Label",
      "mark": {
        "type": "text",
        "baseline": {
          "expr": "datum['act_label_baseline']"
        },
        "yOffset": {
          "expr": "datum['act_label_offset']"
        }
      },
      "encoding": {
        "y": {"field": "Sales"},
        "text": {
          "field": "Sales",
          "format": "#,##0",
          "formatType": "pbiFormat"
        }
      }
    }
  ]
}
Many thanks!
Sebastian