Hello @nikahafiz,
You’re Welcome!!! ![]()
I’m glad that I was able to assist you.
Here’s the explanation about why the old measure didn’t work and how it was corrected to achieve the results -
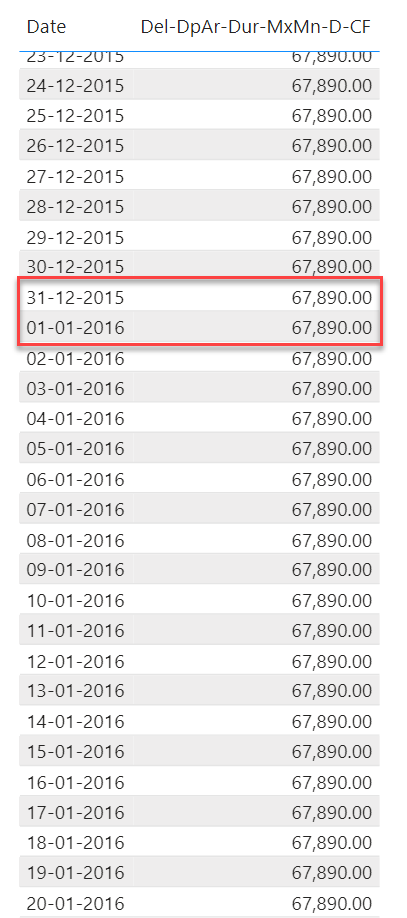
In the old measure, the function that was referenced was “ALLSELECTED()”. Now, this function works in similar manner in comparison to the “ALL()” function when nothing is selected on the report. So since there’re no slicers onto the report, the results which will be evaluated in this scenario is as good as “ALL()” function being referenced inside the measure. And therefore, it evalauted the MAX and MIN values for the entire time period i.e., for the both years 2015 and 2016. Below is the screenshot provided for the reference -
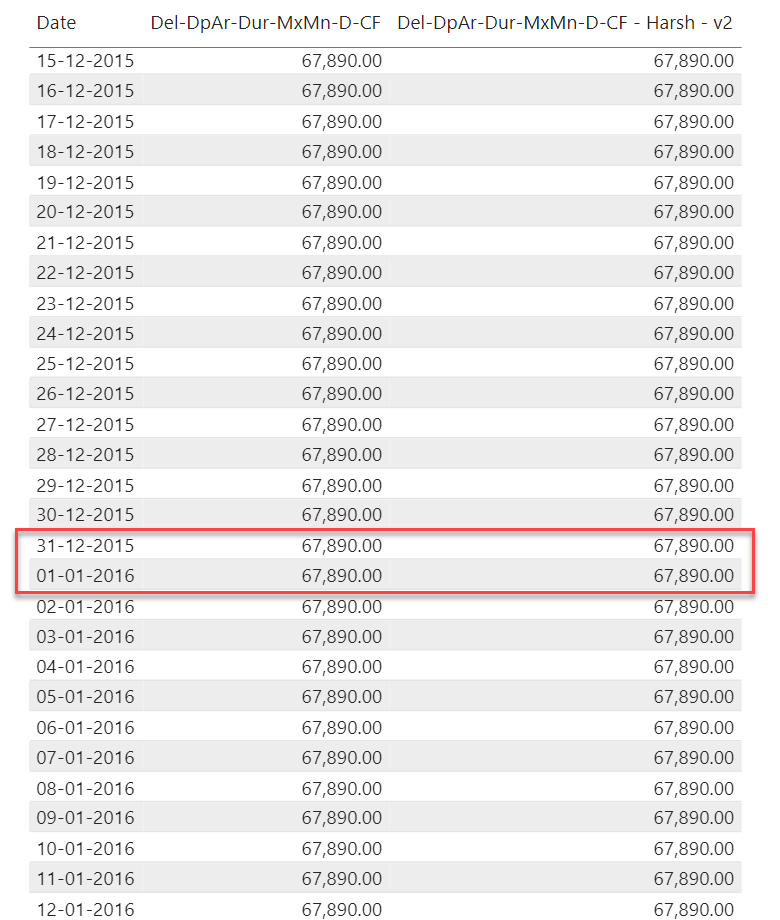
As you can observe in the above screenshot, eventhough the years change but the MAX values remain same for both the years. And therefore, since we want the MAX and MIN values for each year and not for the entire time frame. We made a usgae of “ALLEXCEPT() and VALUES()” function.
So when “ALLEXCEPT()” function is used, it removed the context at the Yearly level giving us the exact same results like you were getting it previously. Below is the screenshot provided for the reference -
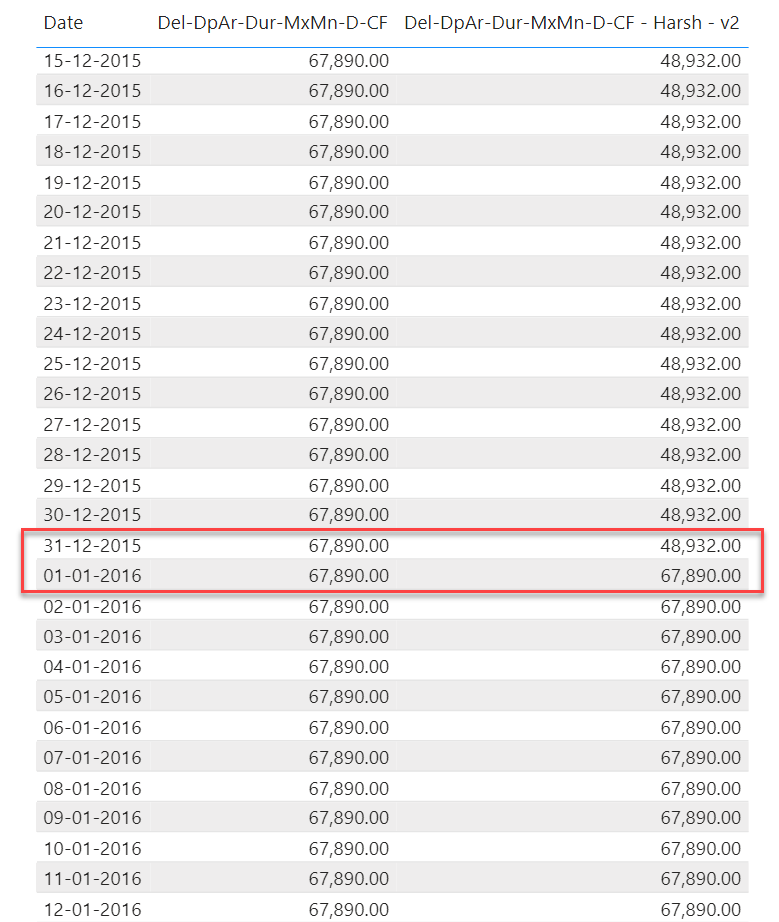
But now, when we reference “VALUES()” function inside it, we are bringing in back the context which was previously removed from all the Years. And now, we’ll get two different MAX values for two different years i.e., one for 2015 and one for 2016. Below is the screenshot provided for the reference -
I’m also providing few of the links below pertaining to this topic for the reference purposes.
Hoping you find this explanation helpful and strengthens your understanding of this concept.
Thanks and Warm Regards,
Harsh

