Hi guys,
Today , I would like to know if someone has ever done the highlighting of Min & Max value for each row in a matrix visual. I am able to find the max & min values for the entire matrix but not able to figure out a way to highlight the max & min for each row.
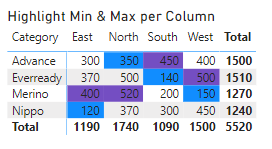
e.g for first row that has advance as category the values 300 & 450 should be highlighted.
Regards,
Hemant
Highlight_Each_Row_for_Max&Min.pbix (23.8 KB)
Hi @Hemantsingh,
Thanks for posting a clear requirement with sample PBIX 
Judging your initial measure, I can’t help but think you were so close to resolving this on your own…
See if this is helpful.
6 Likes
Hi @Melissa,
I am just laughing on myself. Thanks a lot for the correction. I just didn’t see this at all.
Regards,
Hemant
I would like to know if someone has ever done the highlighting of Min & Max value for each COLUMN in a matrix visual. I am able to find the max & min values for the entire matrix but not able to figure out a way to highlight the max & min for each COLUMN not row.
your code work as charm but my goal to apply it on column so for East the max will be 400 and Min will be 120 and so on per column.
Thank you
Hi @XCRMADMIN,
Welcome to the forum.
In future please create a new thread, that way other members can find and thus benefit from it as well.
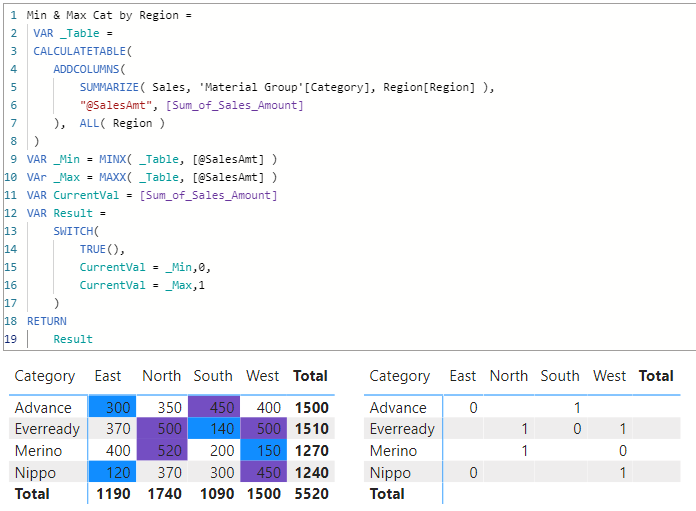
It needs just a small modification to highlight min & max for columns, as illustrated below.
Min & Max for Each Column =
 VAR _Table =
    CALCULATETABLE(
        ADDCOLUMNS(
            SUMMARIZE( Sales, 'Material Group'[Category], Region[Region] ),
            "@SalesAmt", [Sum_of_Sales_Amount]
        ),  ALL( 'Material Group'[Category] )
    )
VAR _Min = MINX(_Table, [@SalesAmt])
VAr _Max = MAXX(_Table, [@SalesAmt])
VAR CurrentVal = [Sum_of_Sales_Amount]
VAR Result =
    SWITCH(
        TRUE(),
        CurrentVal = _Min,0,
        CurrentVal = _Max,1
    )
RETURN
    Result
.
With this result.
The sample file:
Highlight Max & Min in Matrix.pbix (25.0 KB)
I hope this is helpful
.
@EnterpriseDNA @jeanrose87 could you please split this thread into a new one with this title: Highlight Min & Max Values for each Column in a matrix visual.
Thank you.
ok sorry for that.
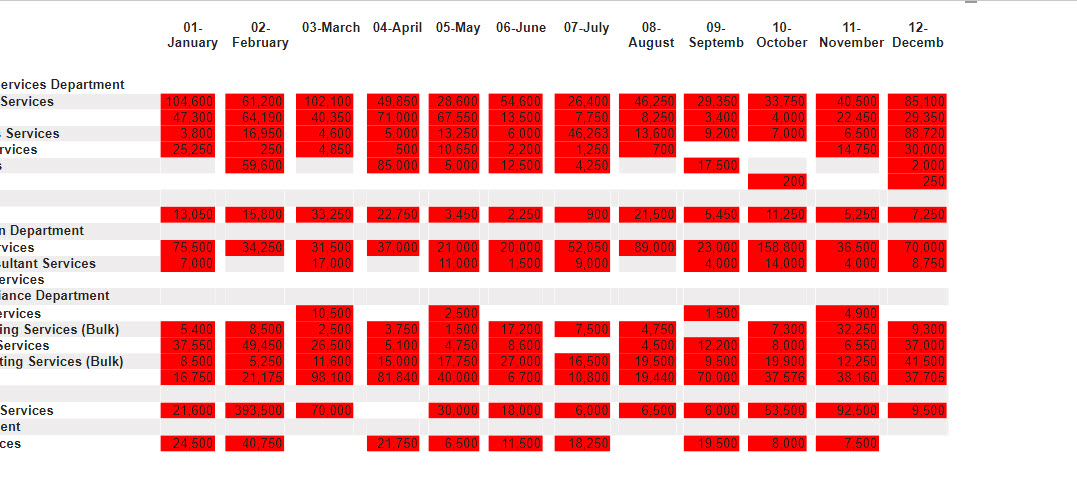
i did what you send exactlly in row version and working as charm, but when shift it as per your examble to column its become nightmare
this the code 
VAR Vals =
CALCULATETABLE (
ADDCOLUMNS (
SUMMARIZE (
DIM_WON_ANALYTICS,
//‘Root’[Name EN],
‘Services List’[Name EN],
‘Date’[UNMMAE]
),
“@SalesAmt”, [Best Selling Product Value]
),
//ALLSELECTED ()
//ALL ( ‘Date’[UNMMAE] )
      All ( 'Services List'[Name EN] )


)
VAR MinValue =
MINX ( Vals, [@SalesAmt] )
VAR MaxValue =
MAXX ( Vals, [@SalesAmt] )
VAR CurrentValue = [Best Selling Product Value]
VAR Result =
SWITCH (
TRUE,
CurrentValue = MinValue, 1,
– 1 for MIN
CurrentValue = MaxValue, 2 – 2 for MAX
)
RETURN
Result
this the result as you see all become red 
Hi @XCRMADMIN,
As you can see this works on the shared sample file.
There’s not much else I can do without a mock-up, containing dummy data of your production model/ PBIX, it could be due to a relationship or … (fill in the dots)
You will get a fast and best response by providing a PBIX