Hi,
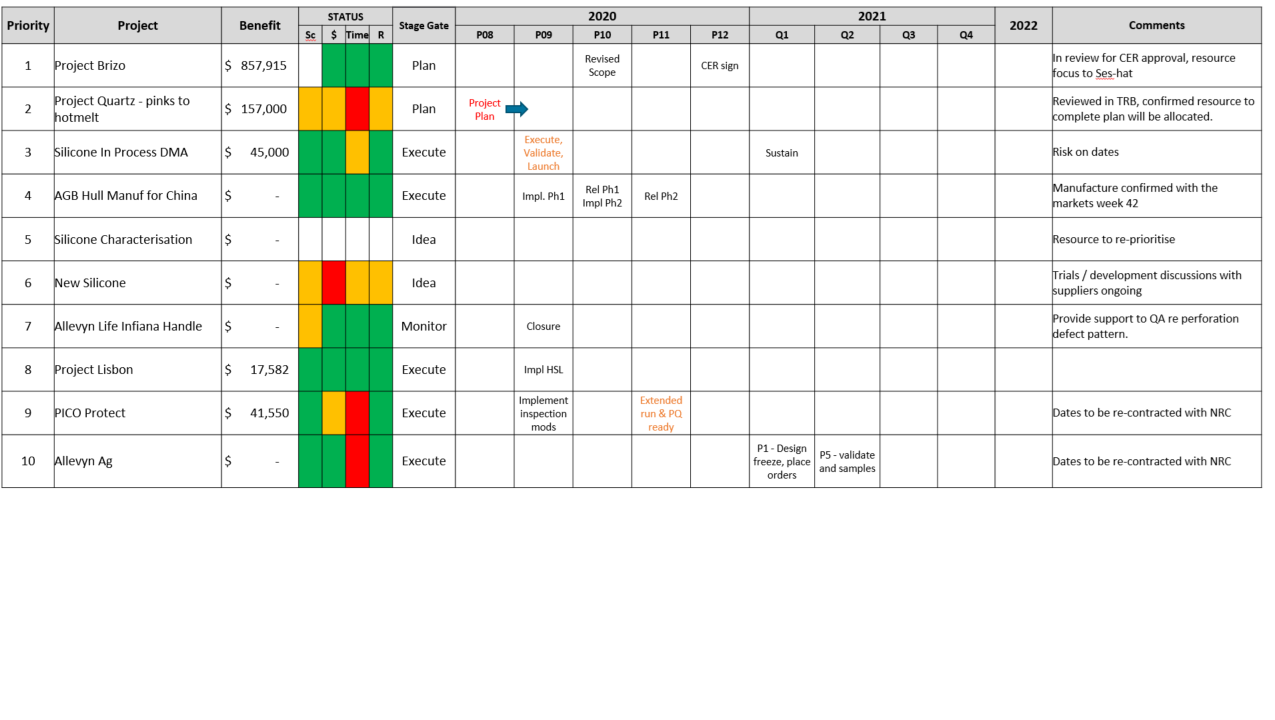
Could we possibly get Power BI to visualize data as below ?
I need help with choosing table or matrix in this scenario.
Thanks
Archer
Hi,
Could we possibly get Power BI to visualize data as below ?
I need help with choosing table or matrix in this scenario.
Thanks
Archer
AFAIK, you can’t have a hybrid visual in Power BI that combines elements of a table and a matrix … perhaps a table visual for the non-hierarchical columns and a separate matrix visual for the hierarchical columns …
Greg