I have an existing Excel function that I would like to replicate in PowerBi. The function calculates the RAG status of multiple metrics/kpi’s based on parameters (essentially weightings) to return the RAG color based on those parameters.
I’ve replicated the metrics and RAG colors for each metric in PowerBi but I need help on how to calculate the RAG Status that was used in Excel.
I hope that makes sense. Attached screenshots and files for reference.
Sorry for the delayed response. Please find attached the PBIX & Excel files.
Please note the following:
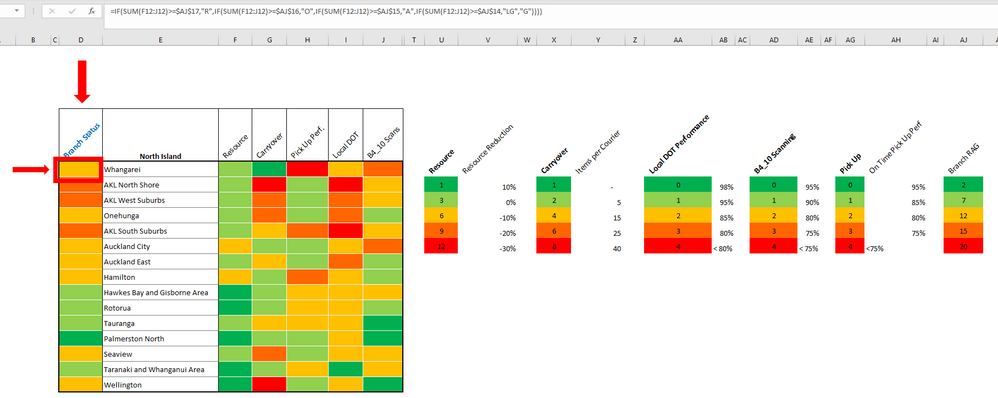
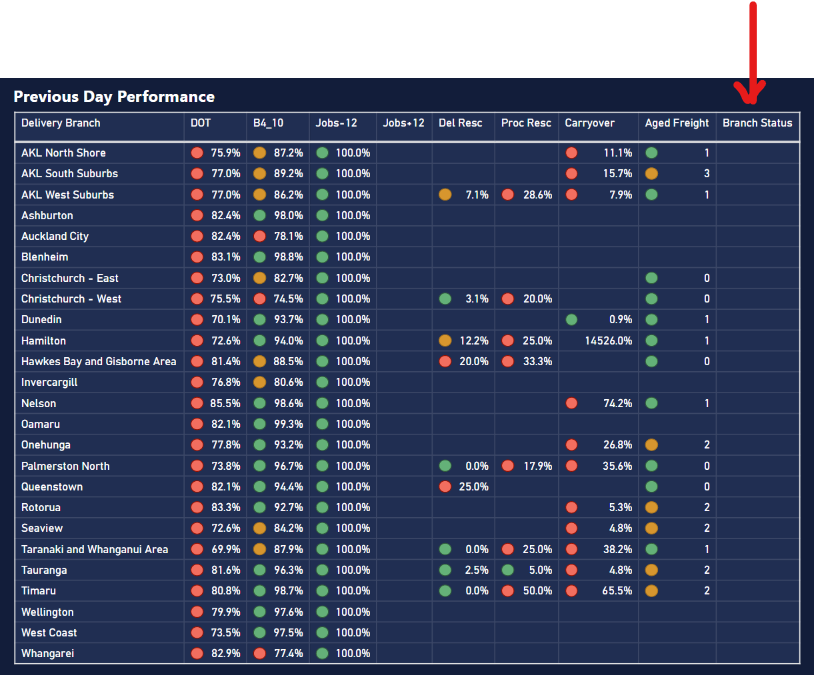
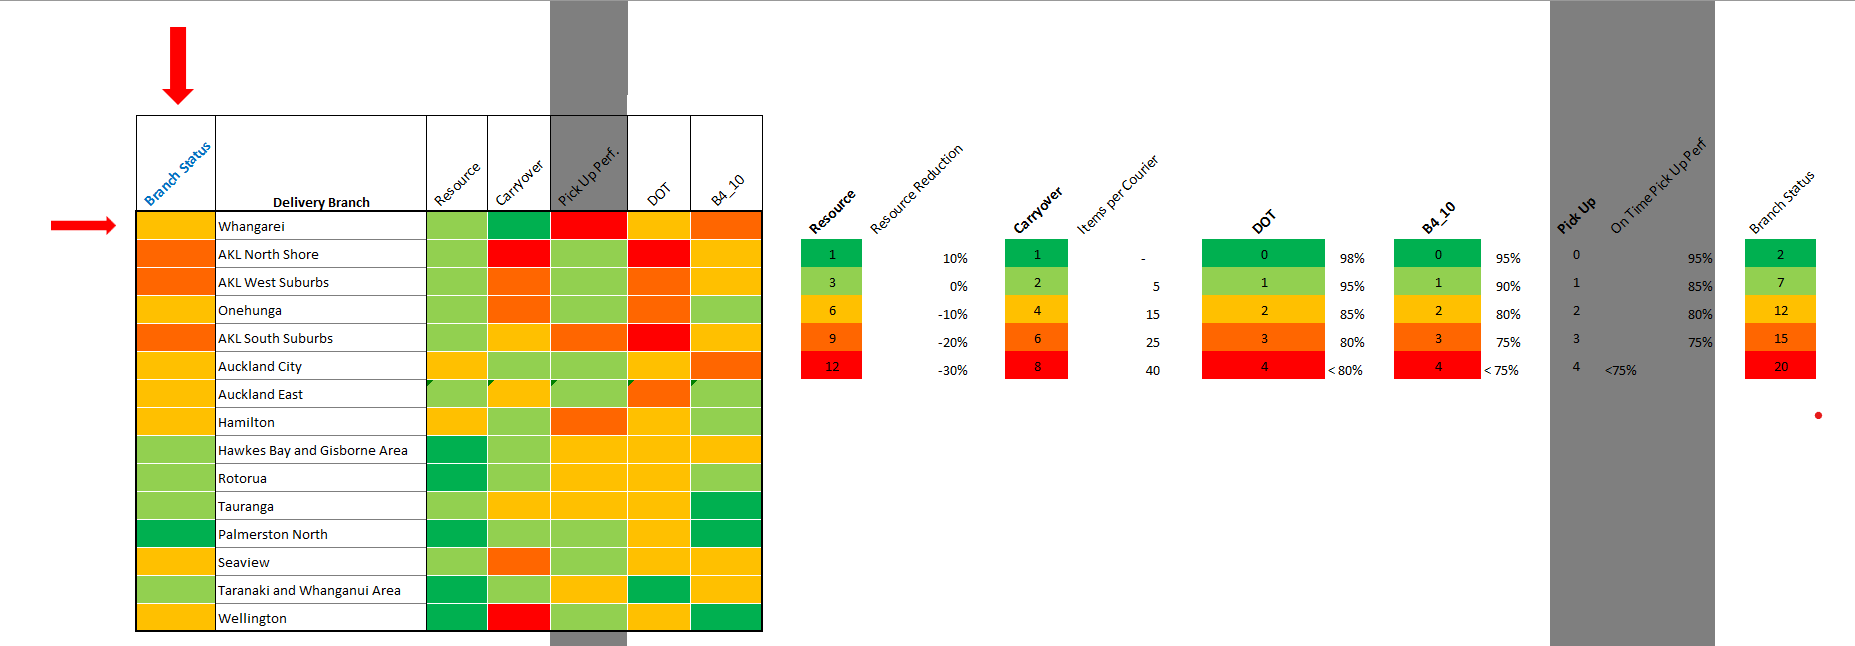
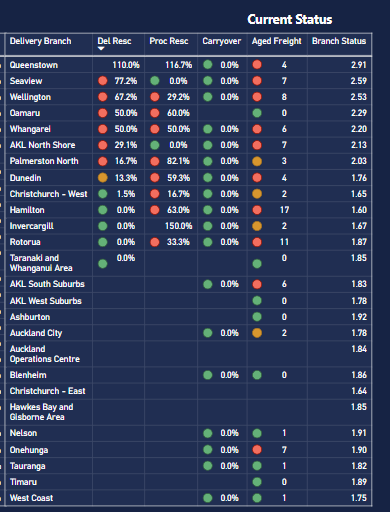
The pbix file contains 2 additional columns/metrics that are not present in the Excel file. Also you can ignore the greyed out column in Excel i.e. “Pick-up”. This shouldn’t matter as the logic will be the same i.e. “Branch Status” is based on sum of each row values and then apply conditional formatting based on the sum total. Let’s say Green=1, Amber=2, Red=3. If sum total <10, return Green, If sum total <15, return Amber, If sum total >15, return Red
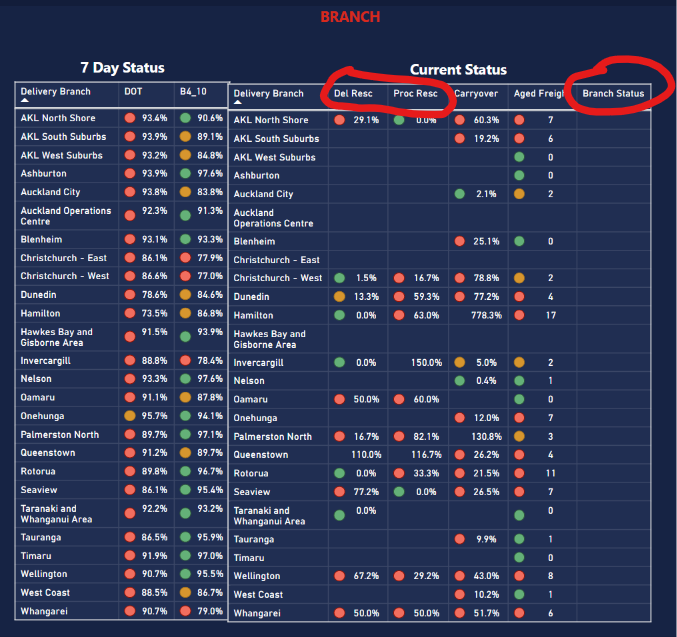
The above logic is based on the premise that all metrics have equal weighting. However there needs to be more weighting applied to the 'Resourcing’ metrics i.e. “Delivery Resource” & “Processing Resource”. So basically Green=2, Amber=3, Red=4. That would mean the “Branch Status” goes Amber / Red faster if the resourcing metrics are out…if both red (=6) then the Delivery Branch will go Amber, if three other metrics are Amber the Delivery Branch will go Red etc
I hope that makes sense and apologies for the info overload. The Excel file was created by someone else and I’m finding it difficult on how to replicate the process/logic in PowerBi.
Does this measure produce the result you are looking for?
Branch Status =

VAR _DelResource = SUM('Daily Network Status Update'[Delivery Resource] )
VAR _CarryOver = SUM( 'Daily Network Status Update'[Carryover KPI] )
VAR _DOT = [DOT Last 7 days]
VAR _B410 = [B4_10 Last 7 days]

RETURN
     _DelResource +
     _CarryOver +
     _DOT +
     _B410
and here’s the screenshot (I didn’t update with the conditional format - you seem to have that part down)
One note - as you can see in my measure, I had to create formulas for the Resource and CarryOver parts - because you used the column to get your value. It is always recommended to use a measure instead of just dragging a number column into your table. One of the reasons for this recommendation is exactly this type of use - you’ll need it in other spots, and if you have to create the variable multiple times - then you’re forcing the calculation to happen multiple times - instead of just using the simple SUM measure result repeatedly.
@Heather so sorry for the late reply. Thank you for your prompt feedback and tips. I have implemented your solution and will submit to users for feedback and let you know if any issues. Appreciate your help.
Hi @melq64, good to know that you are making progress with your query. Please don’t forget to mark as solution the answer that solved your query. Thanks