Hi,
I am looking for guidance on whether these visuals exist for Power BI as a custom visual or any workaround to produce this data as depicted in the below images?
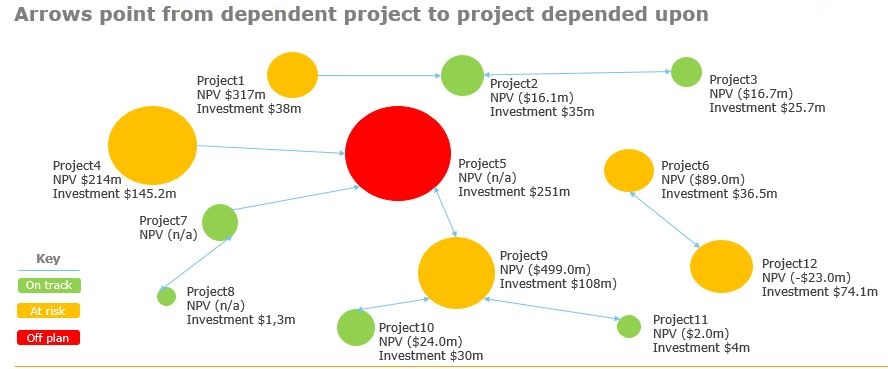
Projects Interdependency
This Visual displays Projects interlinked to each other so the Arrow direction is important.
Resource Demand
This above visual captures Resource capacity that is allocated to Projects by Years/Quarters in groups

Thanks
Archer
@Archer,
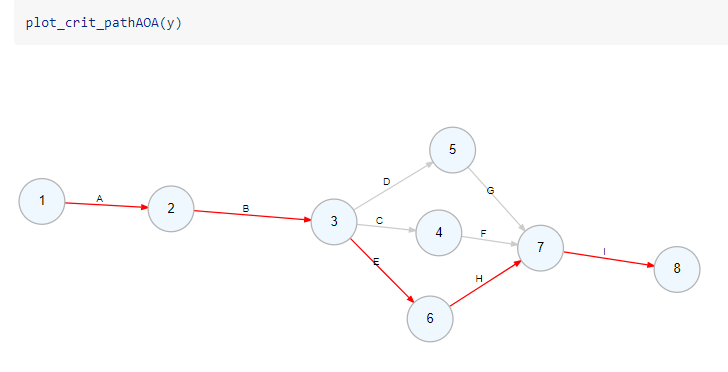
Hmmm…the first one is basically a PERT chart, correct? I’m not aware of any custom visuals for that in Power BI. This leaves two primary options, R and Charticulator.
There is a package in R called CPMandPERT that allows you to create some fairly highly-customizable PERT Charts.
I’d recommend taking a look at this to see if it will meet your needs:
https://cran.r-project.org/web/packages/critpath/vignettes/CPMandPERT.html
@MudassirAli or @JarrettM could give you a better sense as to what’s possible in replicating this chart in Charticulator, though I suspect it’s totally doable.
With regard to the bottom chart, you have more options. You could create a home-brewed version of this via the matrix visual using the techniques that @sam.mckay lays out here:
There are also a wide array of custom Gantt visuals, both free and paid, in Appsource that could produce something similar. Some of the paid ones (Xviz and Zebra BI, if I recall correctly) are very highly customizable).
Finally, this one also could also be done in Charticulator. For that, I would refer you to Part 2 of @MudassirAli 's recent Enterprise DNA course on Advanced Visualization Techniques.
I hope this is helpful.
3 Likes
Hi @Archer, did the response provided by @BrianJ help you solve your query? If not, how far did you get and what kind of help you need further? If yes, kindly mark as solution the answer that solved your query.
I hope that you are having a great experience using the Support Forum so far. Kindly take time to answer the Enterprise DNA Forum User Experience Survey, we hope you’ll give your insights on how we can further improve the Support forum. Thanks!
Hi @Archer, we’ve noticed that no response has been received from you since the 26th of May.
We just want to check if you still need further help with this post?
In case there won’t be any activity on it in the next few days, we’ll be tagging this post as Solved.
Hi @Archer, due to inactivity, a response on this post has been tagged as “Solution”. If you have a follow question or concern related to this topic, please remove the Solution tag first by clicking the three dots beside Reply and then untick the check box.