Hello
I am working on a chart that has a vconcat and line hover property. But I am having issues with a few items…
First of all, I don’t seem to be able to set the opacity of the end labels for the top chart to 0.1 when unhovered. I could do so in the bottom chart by filtering the data for the last year of data, but if I do the same on top chart it looks like it’s propagated down to the other layers - so the bottom chart… as today I have an opacity set at top level to be used with the hover condition, and I need another one that is linked to the year == last year of data to only show labels at the right of the chart.
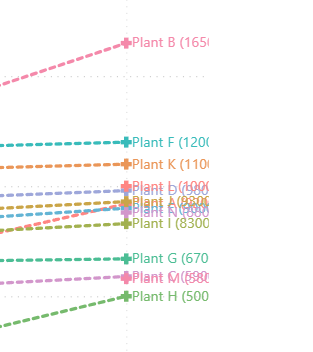
You will see in the bottom chart reading overlaid labels when you hover on them is super clear, on the top chart it is extremely difficult because of the opacity =1.
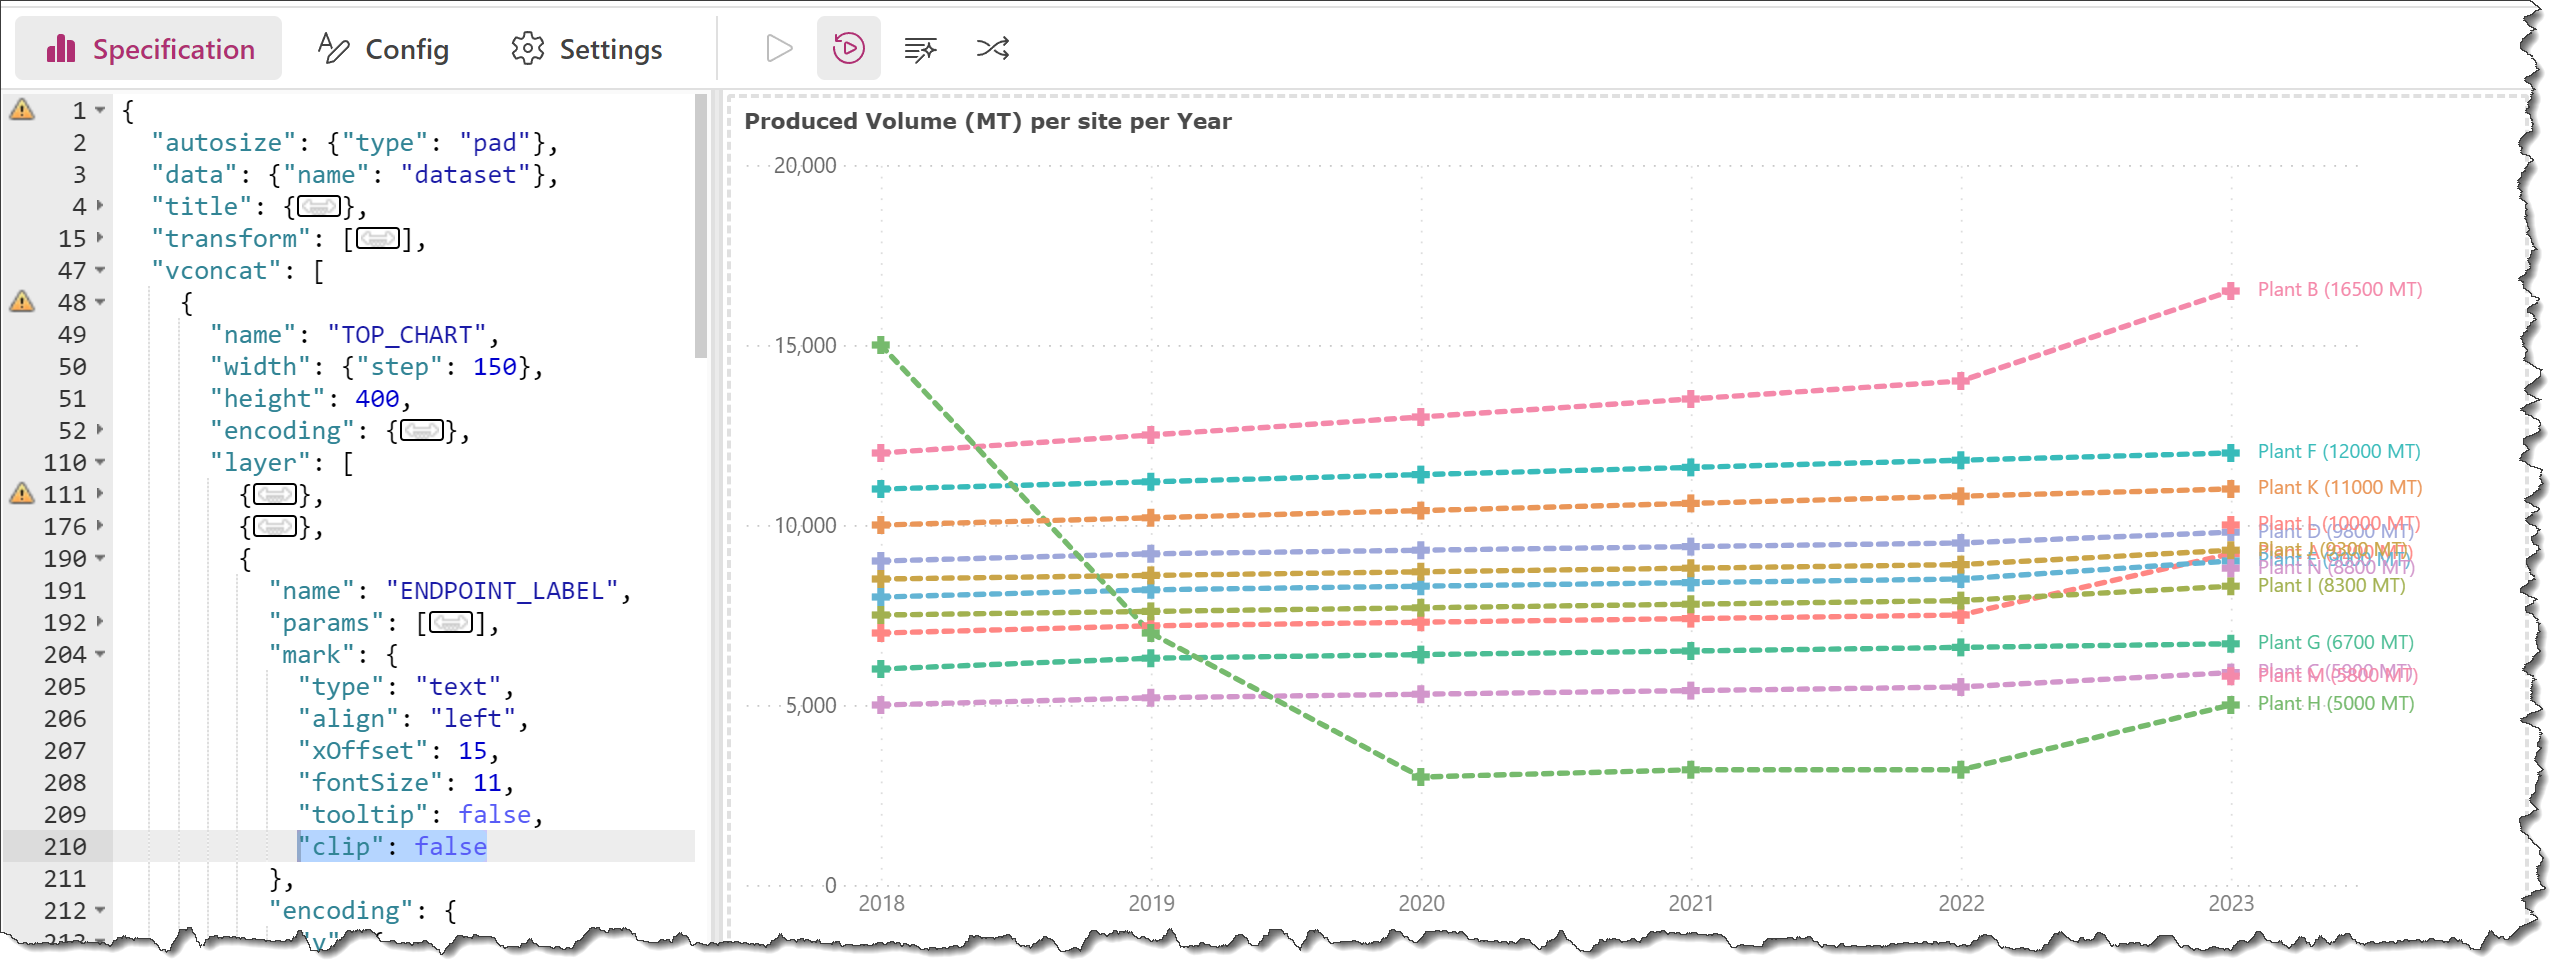
The second issue I have is that text marks are cut off on the right of the chart. I have not been able to find a way to include them completely…
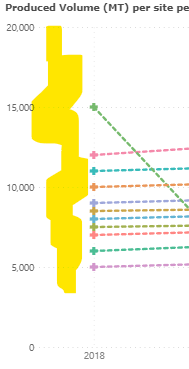
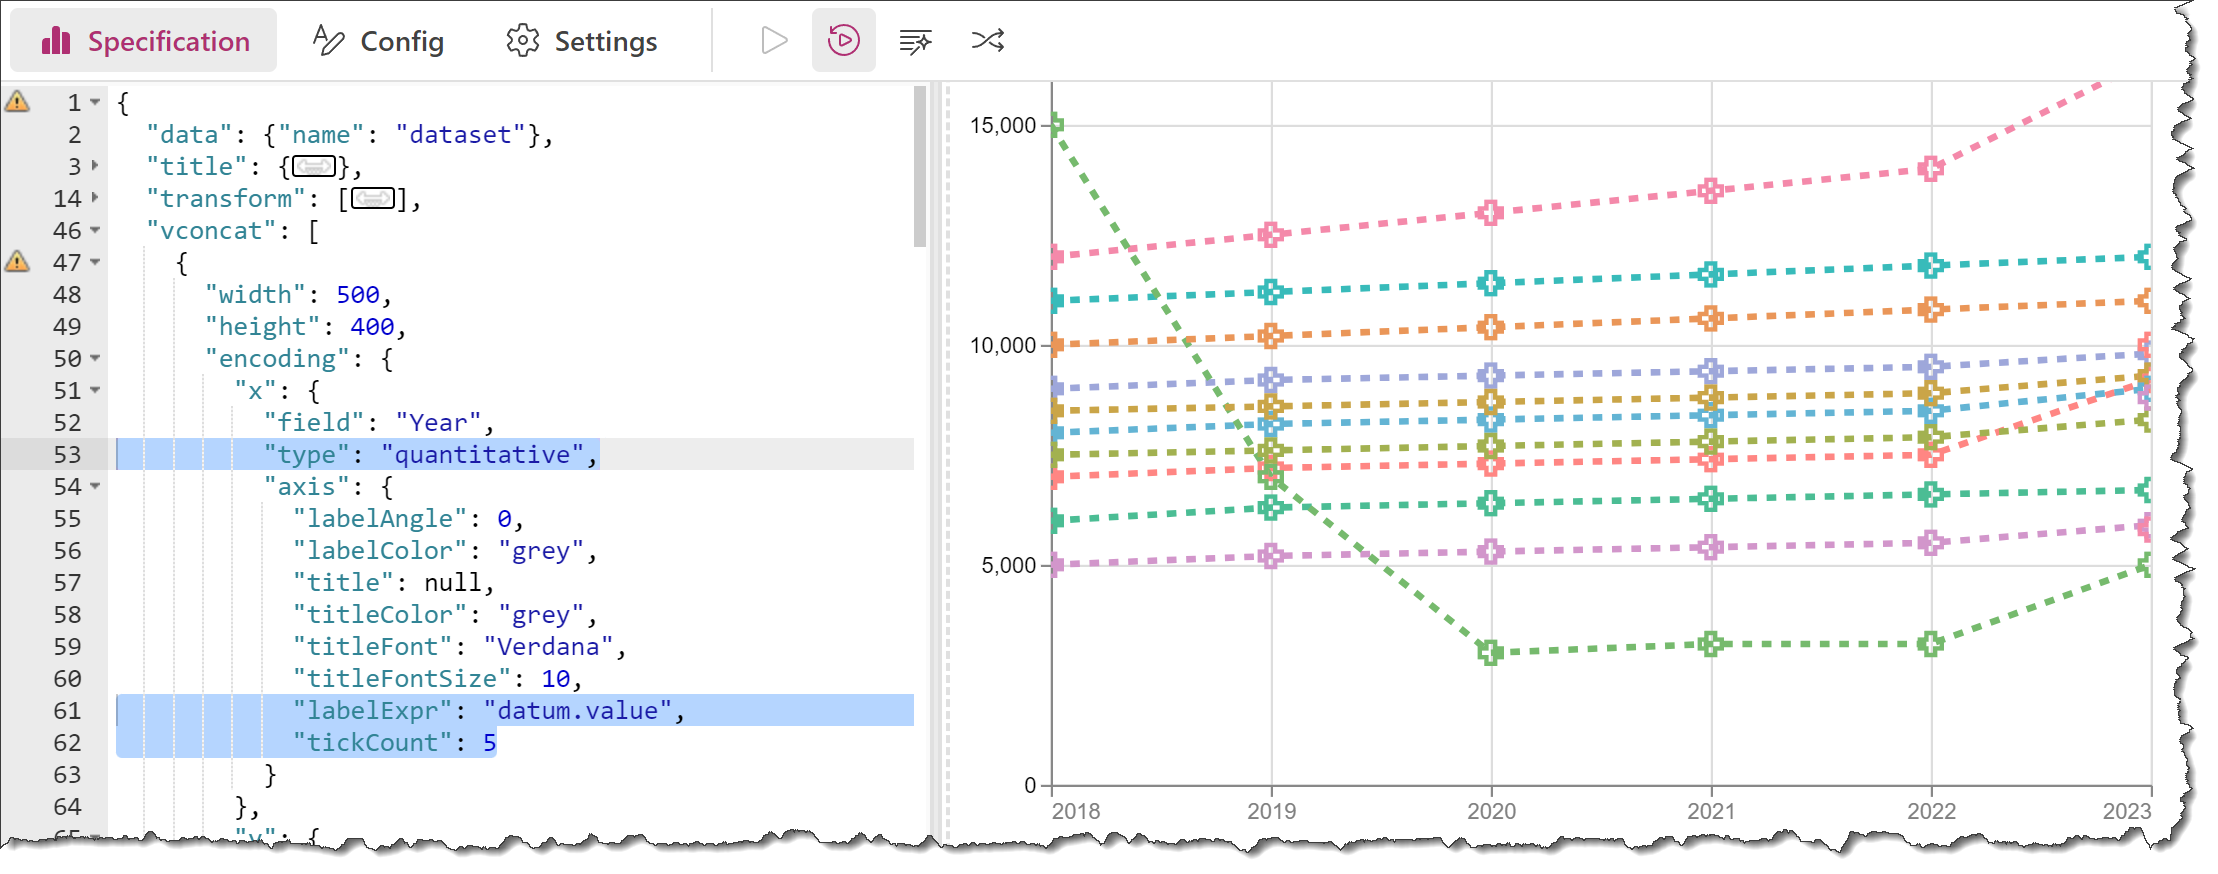
and third - less of a showstopper, but I would like to understand what to do - my grid extends to the left of the axis as I set the offset to 50 in the config otherwise I get a white space:
I have limited time available today so will answer your 2nd question here:
Q2: How to prevent cutoff of text marks at right of chart?
A2:
add “clip”: false to “text” mark
also, use “width”: {“step”: 150} in both vconcat objects to ensure alignment (adjust number as desired)
(Unknown why Vega-Lite automatically does “clipping”; I suspect it does not do it by default for simple visuals but does for composite visuals; anyway, adding clip-false works)
Thanks @Greg ! That works perfectly for labels - I searched for so long, it never came to my mind that Vega-lite was automatically applying clipping… as I had to manually set it to true on a single visual before.
Thanks again
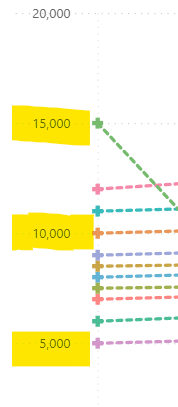
Hello @Greg , I think I found out why Vega-lite is automatically setting clip to true… I think it is because of the scale binding. See what happens with the chart when you start to zoom in or out:
So if clipping is the only way to preserve the length of the text mark I guess this is a catch-22. Either I renounce to binding the scale (maybe I could concatenate another chart and use select instead?), or I make the text marks shorter…
I also found the solution to the opacity issue! I was using a domainMin dependent on data on a certain layer (data_4) for the below chart. However, when I started to do the same for the top chart, I added calculations so the one from the chart below changed data layer… therefore Vega-lite was not finding it any longer.
My lesson here is that is definitely best to do calculations at the beginning for all layers - so they will not move…
I finally got a bit of time to investigate your 3rd question, and it seems Vega-Lite automatically includes an axis label offset when using an ordinal type; when this is changed to quantitative, the {“axisY”: {“labelPadding”: -50}} can be removed from the “config” section. (This looks worse, but illustrates the issue, I think.)
Hi @Greg ! Sorry for the late reply - I was out last week - and thank you so much for investigating this. I had not realized that the offset was dependent on the data type… thanks again!