Hello All,
I am a beginner and have a basic understanding of Power BI and DAX.
I have had a sample dataset ( CSV file attached) with me for quite some time and had a mental block, about where to start from. i.e, how to model it? how to break the table down etc.
Well after spending several hours I came up with this (pbix file attached)
Please can you help me with the following :
1 - your feedback and suggestions if I have modeled it correctly and if there is anything I could improve
2- I created a measure called [Total Wine spend], that I was hoping to display based on age group ( the calculated column that I had created) - Well that isn’t working, I can get the age group in the table, but as soon as I add the measure [total wine spend], the age group disappears.
Your DAX is fine. I have simplified your Age Group measure through the use of a variable, but the logic remains the same:
Age Group =

VAR Age = YEAR(TODAY() ) - Customer[Year_Birth]
VAR Result =
SWITCH(
    TRUE(),
   Age <= 20, "below 20 yrs",
   Age <= 30, "20 - 30 yrs",
   Age <= 40, "30 - 40 yrs",
   Age <=50, "40 - 50 yrs",
   Age <= 65, "50 - 65 yrs",
   Age <= 85, "65 - 85 Yrs",
   "Above 85 yrs"
)
RETURN
Result
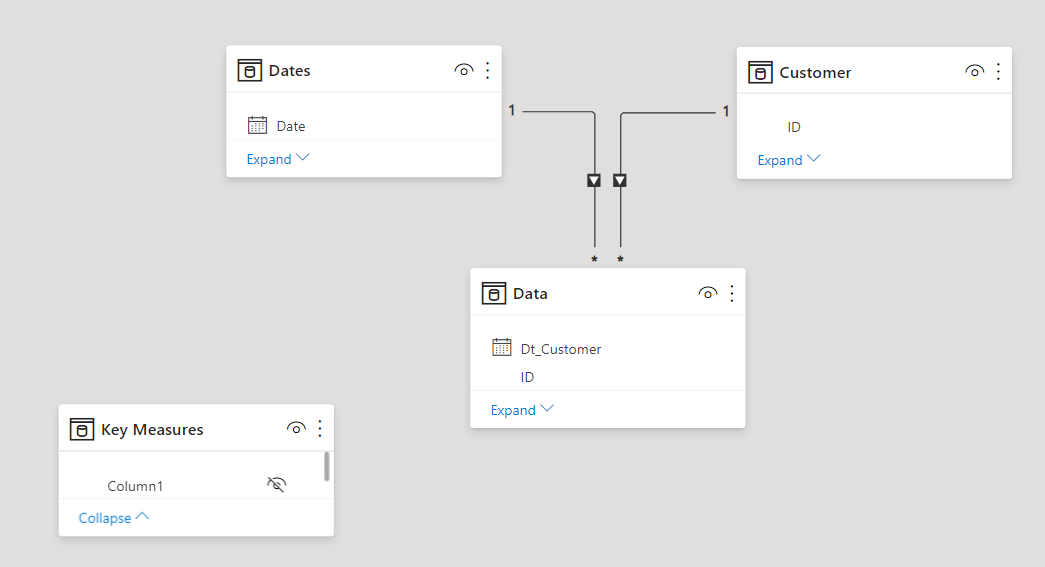
The problem is in your data modeling. IMO, there should be only three tables in this data model: a Dates table (very strongly recommend using Enterprise DNA Expert @Melissa’s Extended Date Table and also downloading the accompanying Cheat Sheet), a Customer dimension table containing all the attributes of a customer that don’t deal with purchasing behavior (that info goes in the fact table I’ve called Data) and are unlikely to change much over time. The three table are organized in a standard star schema, with one to many relationships, and the Dates table is marked as a date table. Here’s what that model looks like:
Your model subdivided the customer attributes into each of their own separate tables, which forced you to create a lot of artificial, unnecessary key fields, that in turn broke the DAX measure.
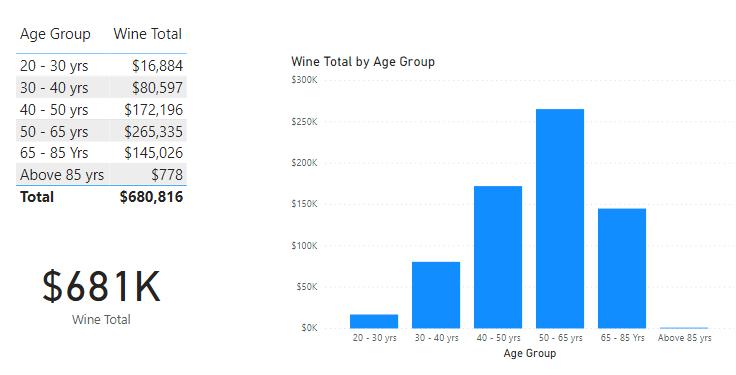
WIth the new data model, the simple [Wine Total] measure calculates accurately in context:
I would strongly recommend that you take @sam.mckay’s excellent portal course entitled “Advanced Transformations and Data Modeling”, where he goes over all of these concepts in detail.
I hope this is helpful. My full solution file is attached.
I really appreciate your response. I did realise that I was getting stuck with the modelling part more than anything else.
I will be taking the “Advanced Transformations and Data Modeling” course immediately. and pursue this dataset further for analysis.
Glad to help, and good to hear that was useful for you. When I started with Power BI, I fell into a trap that many others do as well - I fell in love with DAX and glossed over the data modeling and Power Query aspects. However, I now realize that those aspects are more important (at least IMO) than DAX, because if you build an excellent data model and do everything “upstream” that should be done in PQ, it will both dramatically reduce and simplify the DAX you do have to write.