Ok so there’s quite a bit to this one. We will need to use a combination of a few techniques.
One of the harder techniques is using formula similar to what you would use with cohort analysis. Because to create the payment 1, 2, 3 dates, you need to create a supporting table to make it work.
Also this is quite similar to another project based example I have done recently where there was a need to create a table with specific days after a start date…similar to what you need here
There’s a couple of difference to these, but some similar techniques.
This isn’t easy though I must say.
So here’s how you would do it.
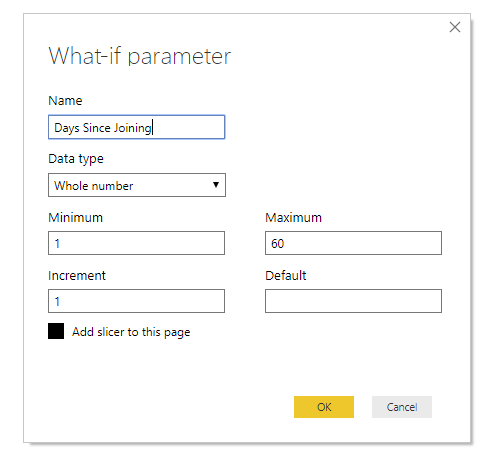
First I’m just going to create a table with numbers 1 - 60 (this can be whatever you like though)
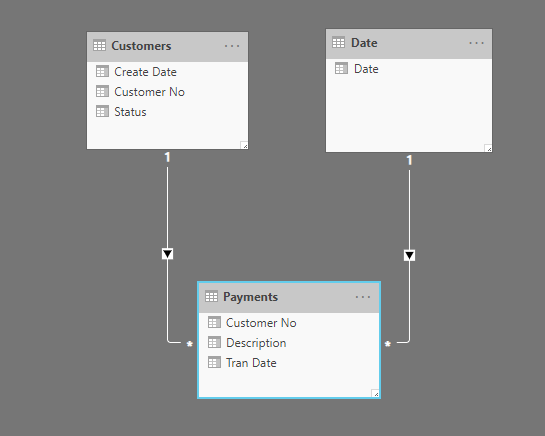
This is all you need for your model. You should never have to join two lookup tables together.
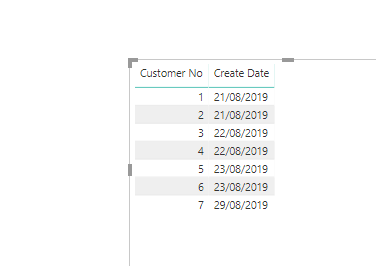
Basically your create date now is kind of like the cohort date from the example above, it’s just more granular at a daily basis
Then from here I created some formulas to bring it together
Created Date = SELECTEDVALUE( Customers[Create Date] )

Days After Joining =
AVERAGE( 'Days Since Joining'[Days Since Joining] )

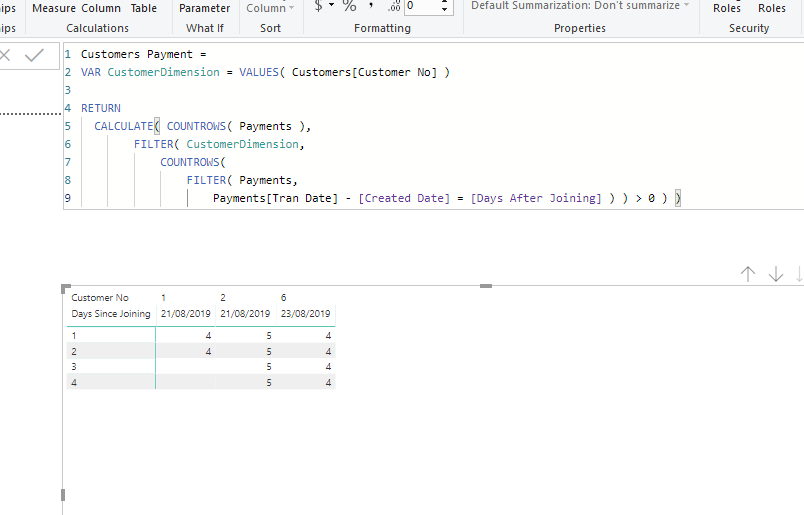
Customers Payment =
VAR CustomerDimension = VALUES( Customers[Customer No] )

RETURN
  CALCULATE( COUNTROWS( Payments ),
        FILTER( CustomerDimension,
            COUNTROWS(
                FILTER( Payments,
                    Payments[Tran Date] - [Created Date] = [Days After Joining] ) ) > 0 ) )
This one below is the main one
And I have it in a matrix
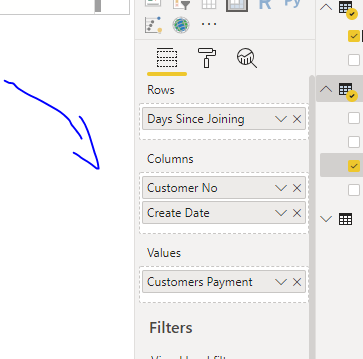
Have a play around with the below pbix and see if this is what you were looking for
Test (1).pbix (39.4 KB)
Thanks
Sam


