[I am using Power BI desktop and Power BI report server, we do not currently have the service so I cannot use field parameters as they have not been introduced into the report server yet]
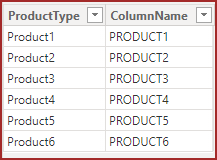
In a table from SQL, I have 6 columns that I am needing to be used under a single slicer as they are considered all a type of product. Each column contains the number of products sold for a specific date and time of that product. For example, on 12/1/2023 at 12:00 am, I can have numbers greater than 1 to represent that number of products for that date and time for each product type that was sold (so in my table in a single row I can have 0 for 1 of 6 product types to represent none were sold, and numbers greater than 1 for each of the 6 columns that that specific product was sold). Hopefully that makes sense to paint a picture of what I am working with here.
Up until recently I only had 3 product types [columns] and could unpivot the data to represent a single column and would have a result for each product sold and in the new unpivoted column it would label which type and I could count rows on that column to represent totals and then use a slicer on that column. The problem is that now we had to introduce 3 new product types and my result set went from 70 million rows to over 700 million rows with the unpivot method and I can barely get power bi to run. I am needing a solution for slicing the data on product type. I am struggling to find a workable method as of this time and am hoping someone else who has been in a similar predicament has figured something out.