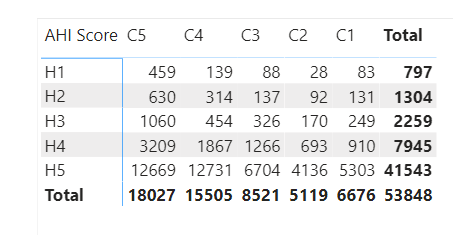
If I understand this correctly, I think you can accomplish this with two simple measures – one for count (COUNTROWS( fact table )) and one for conditional format color. Is this generally what you’re after?
If so, if you can please provide the data file, we can use Column by Examples in Power Query to easily label the H scores and the C scores with the appropriate category labels.
Then if you can provide the appropriate cutoff points for each color, we can build a SWITCH (TRUE ()) construct to do the conditional formatting of the background colors for the heat map.
I hope this is helpful.
– Brian