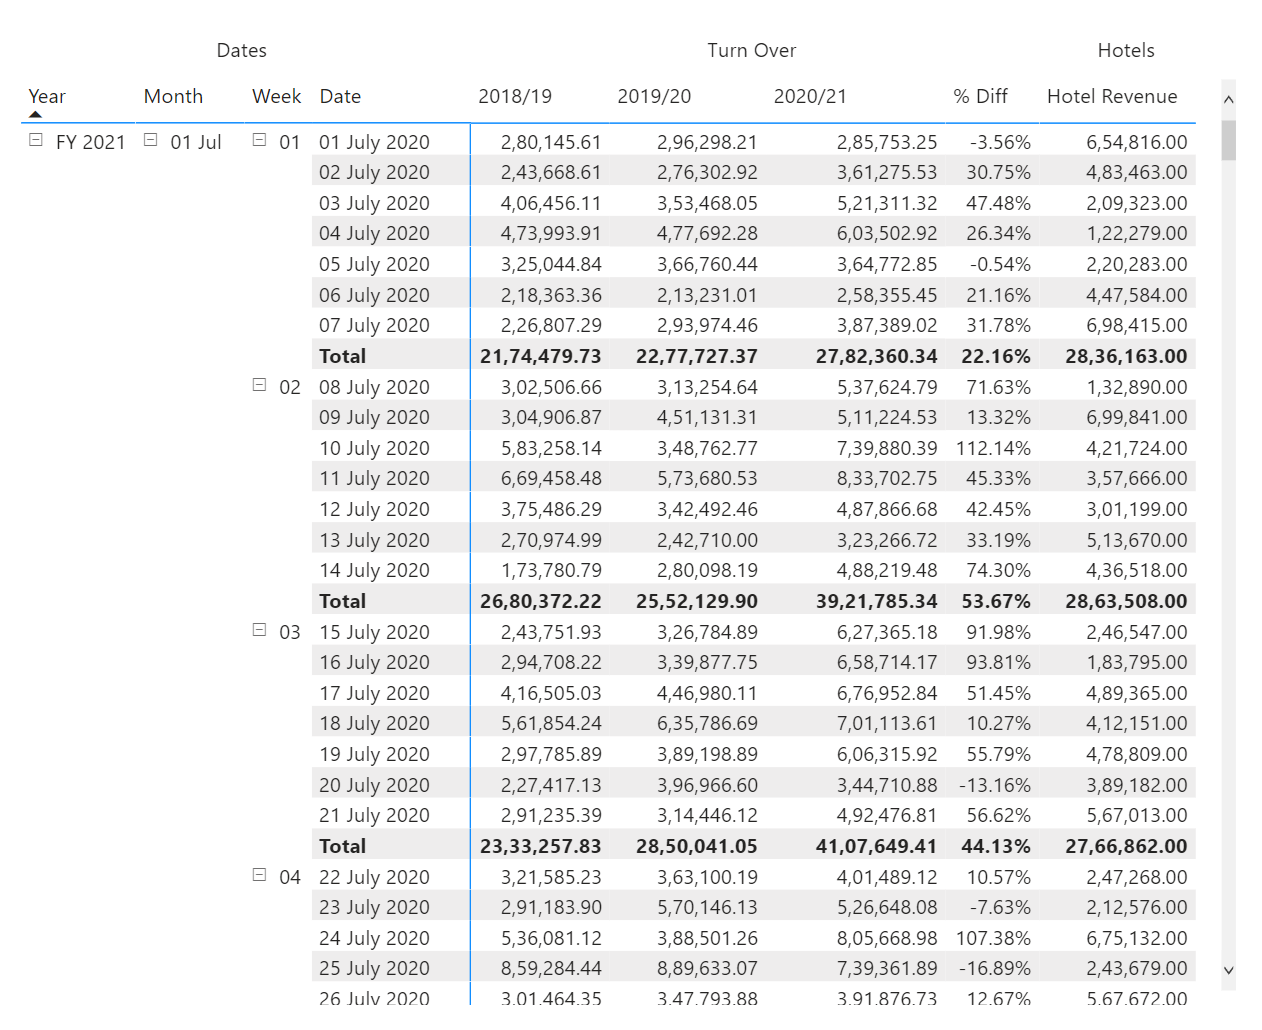
Hi everyone, how can I have headings / sub-headings on my Matrix Visuals? Attached is the snapshot of the result that I am trying to achieve (color red headings). Please find attached a sample pbix file. Thanks 

Sample PBIX.pbix (418.4 KB)
Hi everyone, how can I have headings / sub-headings on my Matrix Visuals? Attached is the snapshot of the result that I am trying to achieve (color red headings). Please find attached a sample pbix file. Thanks
Sample PBIX.pbix (418.4 KB)
Hello @ronald_balza,
Thank You for posting your query onto the Forum.
Well, the solution which you’re looking for may not be directly not possible. But there’s an alternative to achieve that same solution.
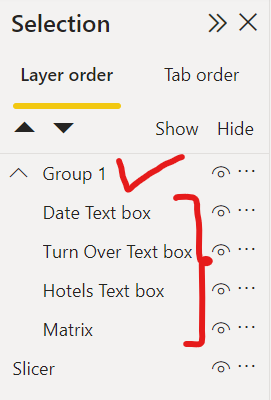
Above the matrix just insert the “Text Boxes” with the name that you want to showcase and then group them with the matrix visual. Below are the screenshots provided for the reference -
I’m also attaching the working of the PBIX file for the reference purposes.
Hoping you find this useful and meets your requirements that you’ve been looking for.
Note: If you want to distinguish each text box then you can add formatting it using the Format pane or can add lines around it by using the same concept.
Thanks and Warm Regards,
Harsh
Sample PBIX - Harsh.pbix (418.8 KB)
Hi, @Harsh thanks for taking the time on this. I have actually done this trick. However, I have 10+ columns in the table on the ‘real’ scenario, and scrolling onto the right doesn’t seem to work, isn’t it?
Hello @ronald_balza,
Well, directly it may not be possible. The reason being is, in Power BI there’s no provision to group the values of the same category under one single hood as far as I know of.
If you have more columns where it requires scrolling then in that case, you can increase the width size of the page and accomodate the matrix accordingly so that scrolling is eliminated.
Until any direct solution is updated, you’ll be required to work with the possible workarounds or alternatives.
Thanks and Warm Regards,
Harsh
I agreed. Thanks, @Harsh for your valuable input. I will tag this a solution then
Hi Ronald,
Please try this way to have headings on matrix visuals by creating a manual table with title name and exact measure names as hierarchy and create a below measure
Sample PBIX.pbix (391.8 KB)
TitleMeasure =
Var One = SELECTEDVALUE(Heading[ColumnID])
Return
SWITCH(
one,
1,[Turnover FY19 v2],
2,[Turnover FY20 v2],
3,[Turnover Amount],
4,[% Diff],
5,Hotel[Hotel Revenue])
Please find the attached PBIX for details.
Hi @selvakumaran, I have downloaded your sample .pbix and I’m following it, but there’s something about the way the Title (renamed to " ") and Column columns have been added that I cannot replicate in my own file. Even in your file, when I remove Title and Column and then add them back, the visual no longer displays the headers correctly. Do you have any advice? Thank you!