Handling multiple tables on 1 sheet

Hallo
hope someone can help me with this problem
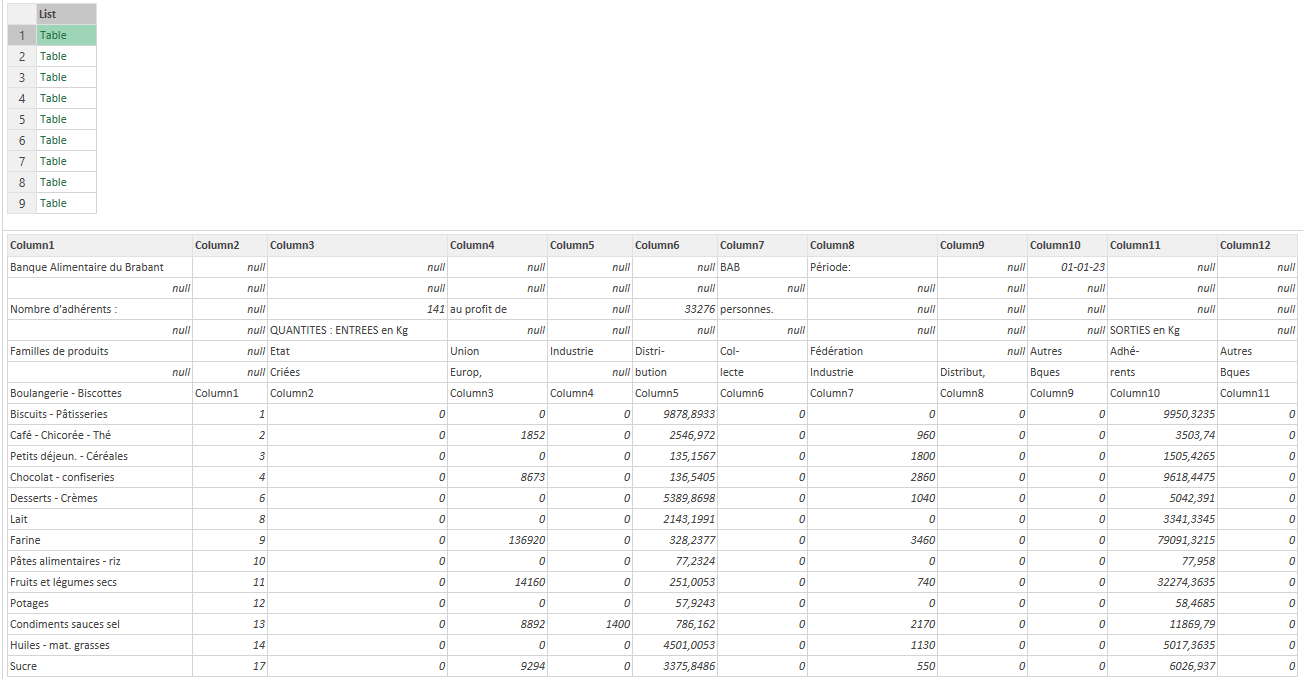
attached a file where on each sheet there are 9 tables
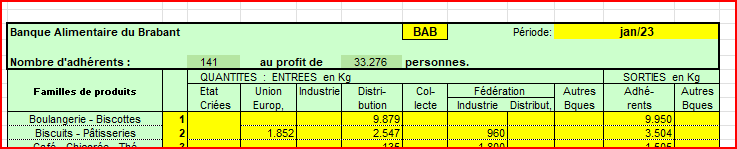
each table has his name ( in the example BAB ) and the corresponding period ( jan 2023 )
the 9 tables are stacked in the sheet january and this sheet contains only the 9 tables of january multiplied with 12 month makes 108 tables per year.
And I have 3 years of historical data. total tables 324
rather then copy and paste I am looking for a more elegant solution

any help is greatly appreciated
kind regards

Roger

Before you send your question.
Make sure that all details relevant to your question is complete:

  • Your current work-in-progress PBIX file - VERY IMPORTANT
  • A clear explanation of the problem you are experiencing
  • A mockup of the results you want to achieve
  • Your underlying data file

Check out this thread on Tools and Techniques for Providing PBIX Files with Your Forum Questions

Also make sure that your data file contains no confidential information. If it does, click the link above.

*** DELETE THIS MESSAGE IF YOU ARE SURE ALL YOUR DETAILS ARE COMPLETE OR IF THE ABOVE INFORMATION IS NOT APPLICABLE TO YOUR QUESTION.***

Hi @Roger,
There is no file attached. Could you provide a sample, preferably including a view of the desired outcome for that sample as well?

Melissa sorry about the file
attached an XLSX file with the data for january as an example ( february to december are identical sheets )
I started with naming the yellow cells as tables ( just for two tables to test )
so I can pick the name for the foodbank and added a column for the year month
so I can append the queries.
But this is not the right way
the final goal is to get all the data in one single table to make reports
the numbers in column C are the familly of products ( i can create a dimension table to link to the appended data )

kind regards
Roger

roger

2023 01 foodbanks.xlsx (76.8 KB)

Hi @Roger,

Give something like this a go, open a new workbook and create a connection with your sample file, call that: JANUARY. Then generate this query, name that: lookFor

let
    Source = {"banque alimentaire", "voedselbank"}
in
    Source

Next, this one. It will set you up with a list of tables for transformation.

let
    Source = JANUARY,
    //Excel worksheet errors are propagated; therefore, they should be removed.
    RemoveErrors = Table.AddIndexColumn( Table.RemoveRowsWithErrors(Source), "i", 0, 1 ),
    toColumns = Table.ToColumns( RemoveErrors ),
    findNames = List.Transform( toColumns, each List.Select(_, (x)=> List.Count(Splitter.SplitTextByAnyDelimiter(lookFor) (Text.Lower(Text.From(x))))>1 ) ),
    getColumns = List.PositionOf( List.Transform( findNames, each try (not List.IsEmpty(_) and List.First(_) is text) otherwise false ), true, Occurrence.All ),
    firstSet =  List.FirstN( Table.ColumnNames( RemoveErrors), getColumns{1} -1 ),
    sndSet =  List.RemoveMatchingItems( Table.ColumnNames( RemoveErrors), List.FirstN( Table.ColumnNames( RemoveErrors), getColumns{1}) & {"i"} ),
    getRowStart = List.TransformMany( getColumns, each {findNames{_}}, (x, y)=> List.Transform( y, each Table.FindText(RemoveErrors, _){0}[i] )),
    getRowEnd = List.Transform( getColumns, each List.PositionOf( toColumns{_}, "TOTAL", Occurrence.All) & List.PositionOf( toColumns{_}, "TOTAAL", Occurrence.All) ),
    listTables = List.Combine( List.Transform( {0..List.Count(getRowStart)-1}, each 
        List.Transform( List.Zip( {getRowStart{_}, getRowEnd{_} }), (x)=> 
            [ 
                a = Table.SelectColumns( Table.Range( RemoveErrors, x{0}, x{1} ), if _ =0 then firstSet else sndSet ), 
                b = Table.RenameColumns( a, List.Zip( {Table.ColumnNames(a), List.FirstN( Table.ColumnNames(RemoveErrors), List.Count(Table.ColumnNames(a)))}))
            ][b] 
        )
    ))
in
    listTables

to illustrate.

I hope this is helpful

Melissa,

Thank you very much for the code , you’re a live saver

this will save me a lot of time as volunteer in creating a proper datasets of historical data for 2022 and 2021,

I can use this code for each of the “Month” sheets in my historical file 2022 & 2021

last question:

I see that the row boulangerie – biscottes is shifted one row up and not in line with the 1 in column 2 and the number in column6 = 9878,8933

What line of code do I need to change to correct this

Kind regards

Roger

Hi @Roger,

I haven’t looked into that but expect that to be due to the RemoveErrors step. I urge you to handle all Excel worksheet errors on the worksheet - as errors are propagated when loaded into Power Query.

Cheers,
Melissa