Hello,
I am currently working on a report that involves comparing budget, forecast, and reforecast data. Specifically, I have a baseline budget, the current forecast amount, and several draft reforecast amounts for scenario with mutiple versions.
The draft reforecast version numbers are stored in a dimension table and connected to the draft reforecast fact table. Additionally, I have separate measures for the baseline budget and the current forecast.
To facilitate comparison, I intend to present this information in a matrix visual using Power BI. However, when I attempt to do so, all three measures appear repeatedly in the matrix visual, with the version number added as column to the matrix visual.
Ideally, I would like to have the Budget and Current Forecast values displayed as the first two columns, followed by the different versions showing their respective draft reforecast values.
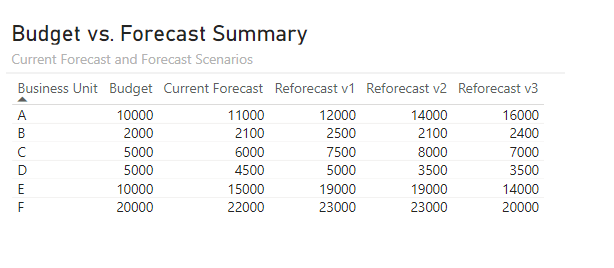
This is how it is currently appearing in the matrix visual -

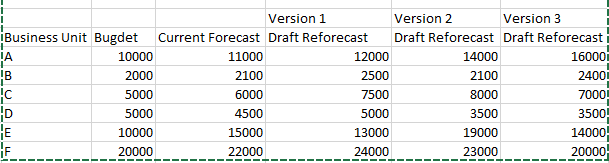
I would like to display this as below:
Please share any thoughts to acheive this.