@supergallagher25 ,
No, your fact table structure is spot on. Long and thin is absolutely the way to go here.
Whenever I run into a grouping problem now, my first thought is Power Query, not DAX. The Group By/All Rows is such a powerful combo for doing this type of analysis. (Again, shout out to @Melissa’s M course, which really helped me navigate the selection/projection issues in the nested tables resulting from the Group By).
Here’s the M code:
let
    Source = Table.FromRows(Json.Document(Binary.Decompress(Binary.FromText("i45WMlTSAWPXvPSczOIMIMtCKVYnWskIQ9wSLG4MFfdNLAEJmoIFTVAFjcGCpjhMMENVbGgAFjVHFTUHC4IEjLAYYYQhbgF3nBHCEAu445AELeGOQzUB5I5YAA==", BinaryEncoding.Base64), Compression.Deflate)), let _t = ((type nullable text) meta [Serialized.Text = true]) in type table [ID = _t, Qtr = _t, Sub = _t, Score = _t]),
    #"Changed Type" = Table.TransformColumnTypes(Source,{{"ID", Int64.Type}, {"Qtr", Int64.Type}, {"Sub", type text}, {"Score", Int64.Type}}),
    #"Grouped Rows" = Table.Group(#"Changed Type", {"ID", "Sub"}, {{"AllData", each _, type table [ID=nullable number, Qtr=nullable number, Sub=nullable text, Score=nullable number]}, {"Row Count", each Table.RowCount(_), Int64.Type}}),
    #"Added Custom" = Table.AddColumn(#"Grouped Rows", "Both Qs", each if [Row Count] = 2 then "TRUE" else "FALSE"),
    #"Changed Type1" = Table.TransformColumnTypes(#"Added Custom",{{"Both Qs", type logical}}),
    #"Scores Table" = Table.AddColumn(#"Changed Type1", "Scores Table", each if [Row Count] = 2 then
Table.SelectColumns( [AllData], "Score" ) else null),
    #"Extract First Score" = Table.AddColumn(#"Scores Table", "First Score", each if [Row Count]  = 2 then
Record.ToList( [Scores Table] {0}? ){0} else
null),
    #"Extract Second Score" = Table.AddColumn(#"Extract First Score", "Second Score", each if [Row Count]  = 2 then
Record.ToList( [Scores Table] {1}? ){0} else
null),
    #"Added Custom1" = Table.AddColumn(#"Extract Second Score", "Percent Growth", each (( [Second Score] - [First Score] ) / [First Score] )),
    #"Changed Type2" = Table.TransformColumnTypes(#"Added Custom1",{{"Percent Growth", Percentage.Type}}),
    #"Removed Other Columns" = Table.SelectColumns(#"Changed Type2",{"ID", "Sub", "AllData", "Both Qs", "Percent Growth"}),
    #"Expanded AllData" = Table.ExpandTableColumn(#"Removed Other Columns", "AllData", {"Qtr", "Score"}, {"Qtr", "Score"})
in
    #"Expanded AllData"
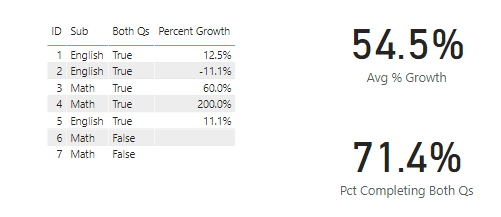
and here’s the result:

The PQ transformations make the DAX for the cards a piece of cake.
I hope this is helpful. Full solution file attached below.

