Hello @AliB,
Thank You for posting your query onto the Forum.
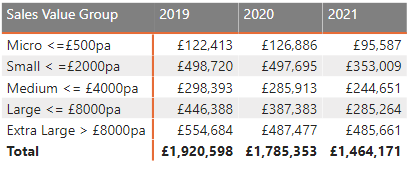
Well, if you want to analyze the “Current Year’s Banding”, “Previous Year’s Banding” and then “YoY% Sales Growth per Banding”. Below are the measures provided for the reference. Since you’ve already created the measure for Current Year’s Banding the below are the measures for Previous Year’s Banding -
Sales per Banding - Previous Year =
CALCULATE( [Sales per Banding] ,
      DATEADD( Dates[Date] , -1 , YEAR) )


YoY% Sales Growth per Banding =
DIVIDE(
   [Sales per Banding] - [Sales per Banding - Previous Year] ,
   [Sales per Banding - Previous Year] ,
   0 )
But if you want to analyze the “Current Year’s Banding” and then directly “YoY% Sales Growth per Banding” without writing a measure for “Sales per Banding - Previous Year” as a mediator. You can write the measure as follows -
YoY% Sales Growth per Banding =
VAR _Current_Year =
CALCULATE(
    [Sales YTD],
       FILTER(
           VALUES( Customers[Customer] ),
               COUNTROWS(
                   FILTER(
                       'Sales Banding',
                       [Avg Sales] >= 'Sales Banding'[Min] &&
                       [Avg Sales] < 'Sales Banding'[Max] ) ) > 0 ) )


VAR _Previous_Year =
CALCULATE(
   CALCULATE(
      [Sales YTD],
         FILTER(
             VALUES( Customers[Customer] ),
                 COUNTROWS(
                     FILTER(
                         'Sales Banding',
                          [Avg Sales] >= 'Sales Banding'[Min] &&
                          [Avg Sales] < 'Sales Banding'[Max] ) ) > 0 ) ) ,
   DATEADD( Dates[Date] , -1 , YEAR) )

VAR _YoY_Percentage_Sales_Growth =
DIVIDE(
   _Current_Year - _Previous_Year ,
   _Previous_Year ,
   0 )

RETURN
_YoY_Percentage_Sales_Growth
I’m also attaching the working of my example of PBIX file for the reference purposes since you didn’t attached any.
Hoping you find this useful and meets your requirements that you’ve been looking for. 
Thanks and Warm Regards,
Harsh
Grouping and Segmenting - Harsh.pbix (618.0 KB)


