In in the linked bar chart I wish to group all locations which rank under 3 in revenue as “Other”. How do I apply the ranking, as used in the Simple Other tab, within the the Stacked Bar Chart?
The logic is simple - apply ranking as is done in the “Simple Other” tab. Assume we want to rank the top three selling stores by $'s ( in this example … UCS, NBU, MP) and then the rest will be designated “Other” (RM, UWS).
I’d prefer using the ranking methodology, as done in the “Simple Other” versus using a DAX measure.
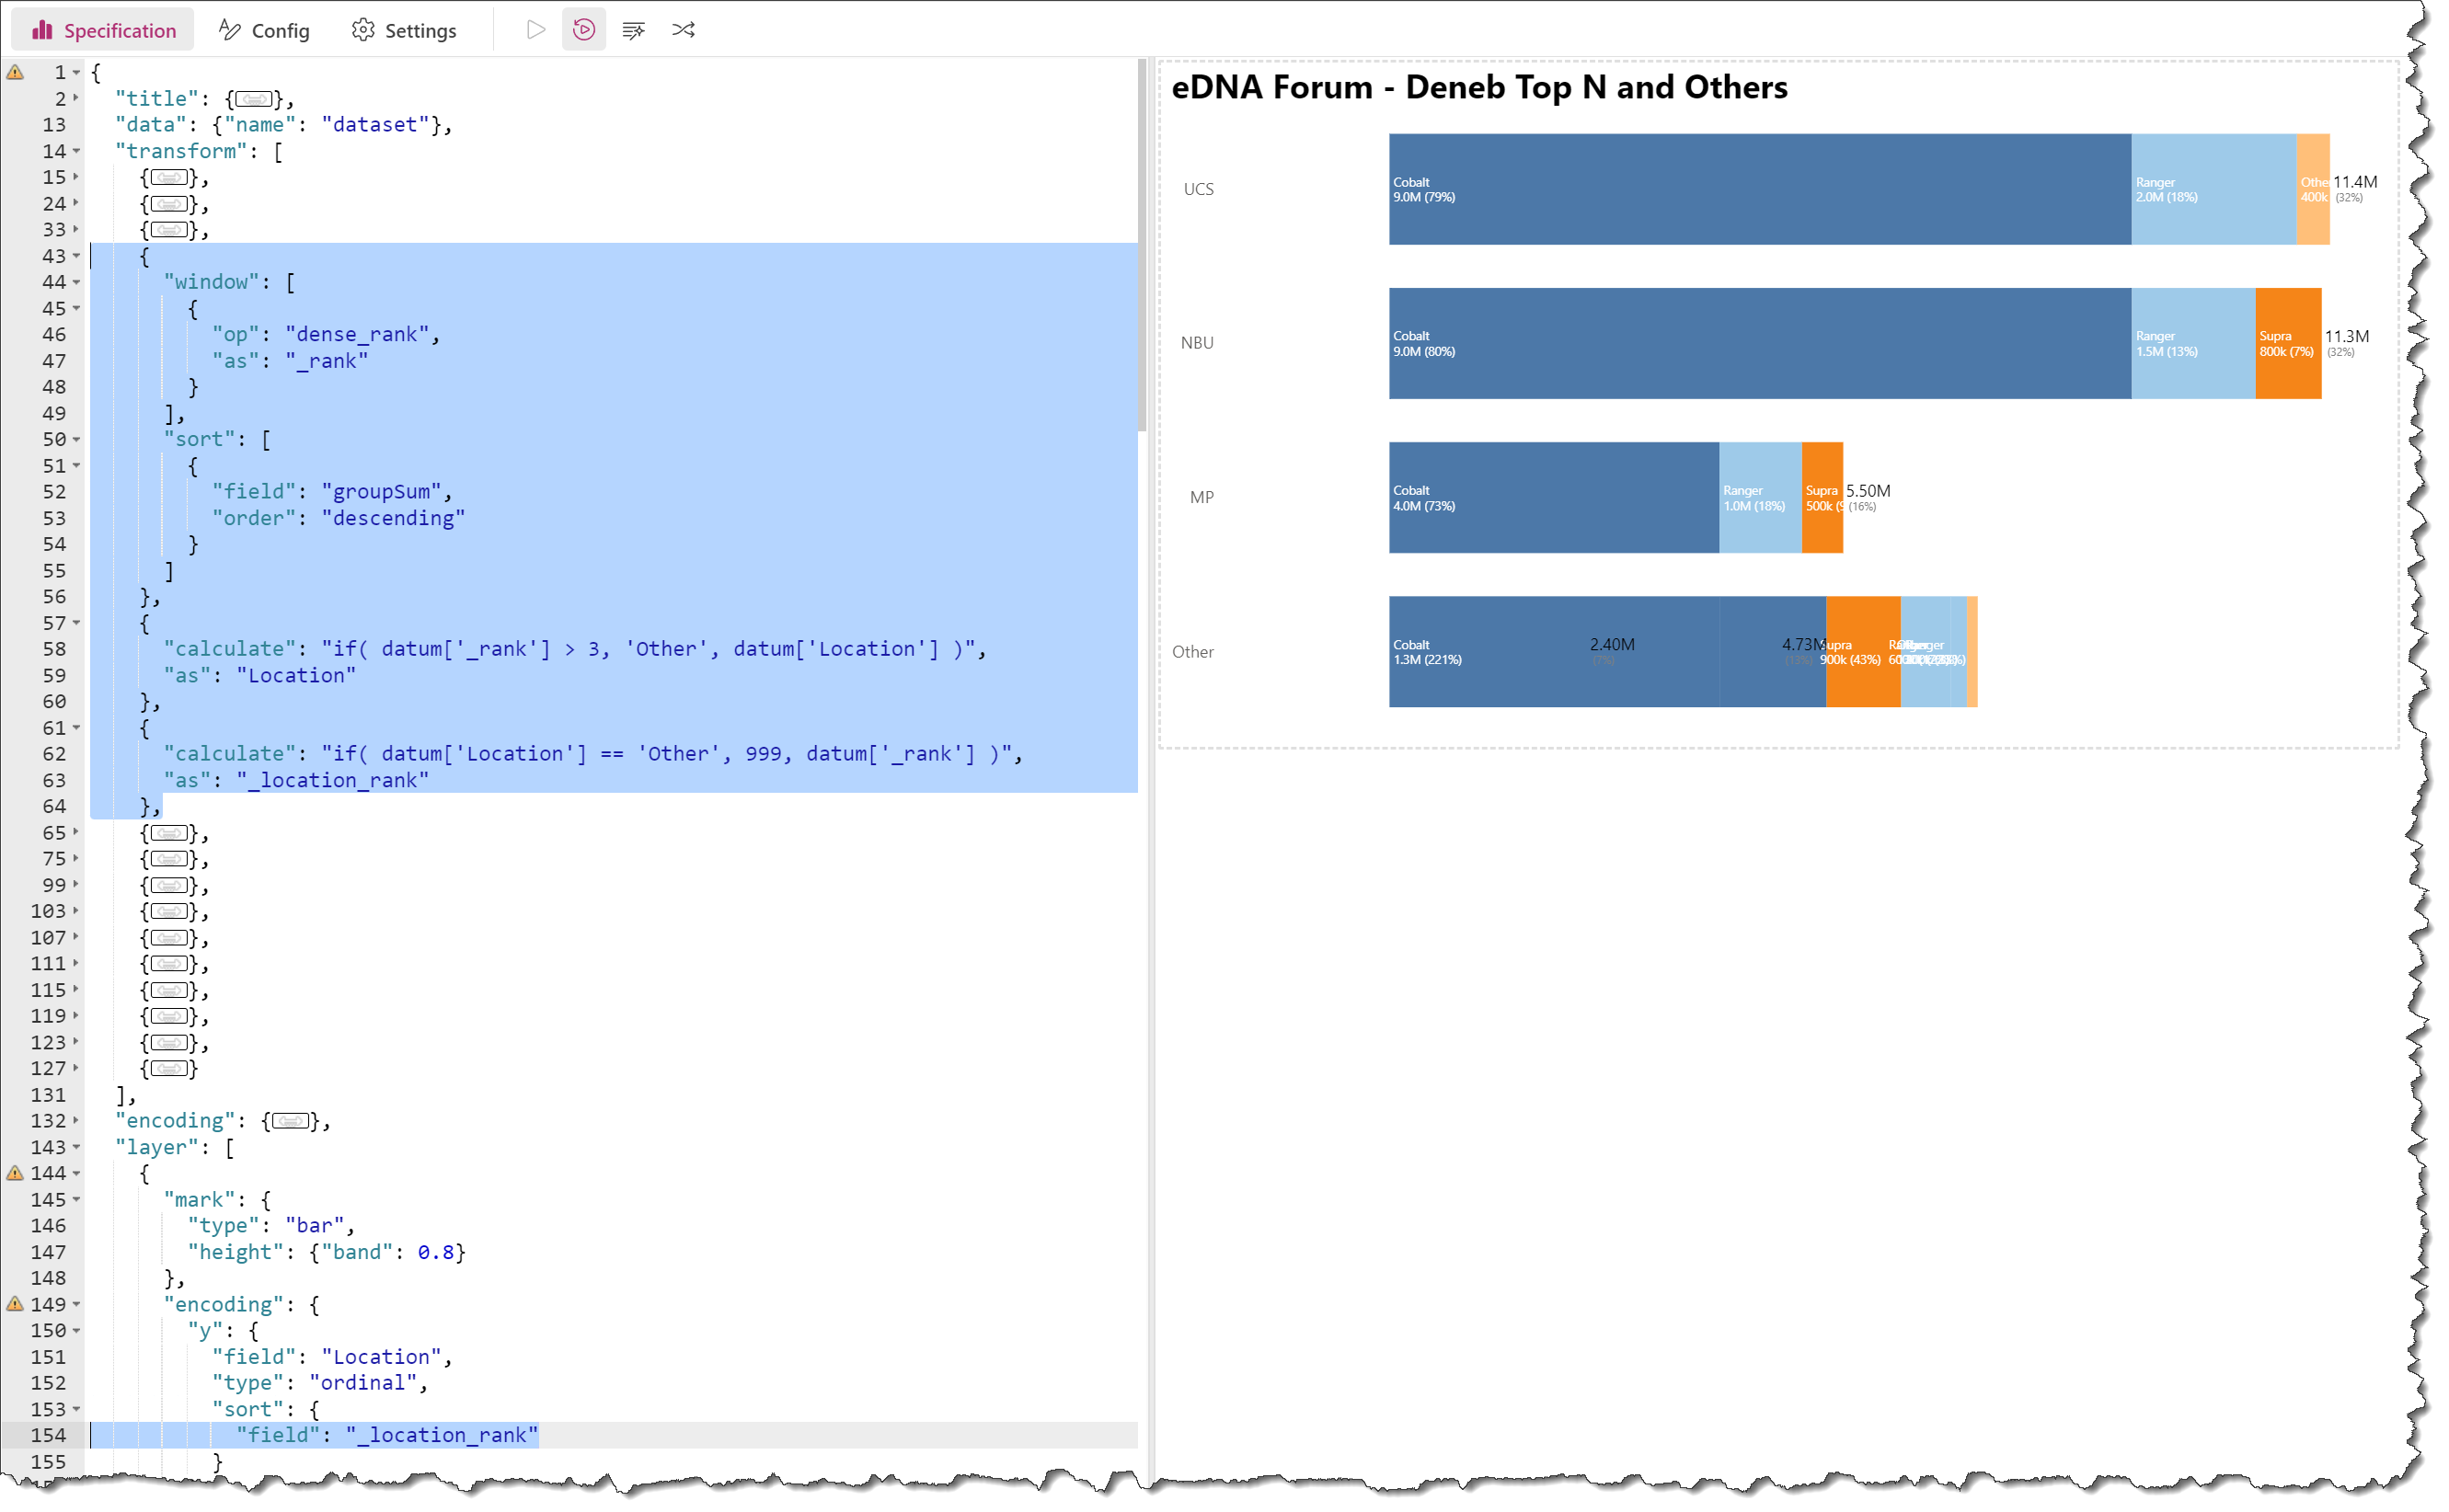
OK, I got part of the way there easily … just add a “window” transform using the “dense_rank” option (as a standard “rank” skips values when there are multiple rows per group [in your case, Location]), then a “calculate” transform to reset all “Location” values with dense_rank > 3 to “Other”, then another “calculate” transform to set rank of the “Other” location to a large number (I used 999). Finally, update the “encoding” of the “Y” axis for the “bar” mark to sort on the new ranking (in my case, _location_rank).
This has created issues with the text marks for the new “Other” location (either multiple segment labels and misplaced/incorrect/missing total values); the “X” values for the segment and group need to be aggregated and recalculated. I have commitments for the rest of the day and won’t be able to pursue further today; in any event, I’d need a while to try to understand this code, as it is not how I would write a stacked bar chart with top N and others. I might try to start again from scratch with this dataset and see what I can come up with, and I’ll post if I come up with anything useful.
Greg, wow, that is sooo close!! If unable to figure in a reasonable time, please go Plan B with a DAX measure. Thank you again for your time and assistance.
Greg, I added a “Test” tab to the linked file. It is my attempt at creating a “Other” location using a measure. I failed. Questions:
I am not sure why I need to pass both the Top10Other and Location fields into the Deneb chart. If not done, then it shows only one location. Regardless, it does not provide a Top3 (per measure formula) by Location and the totals are incorrect by location. Can you assist?
Ideally I’d like to also provide a “Other” category within each Location for Make sales ($) under 25% of the total. I am not sure how to write this. Can you assist with the DAX?
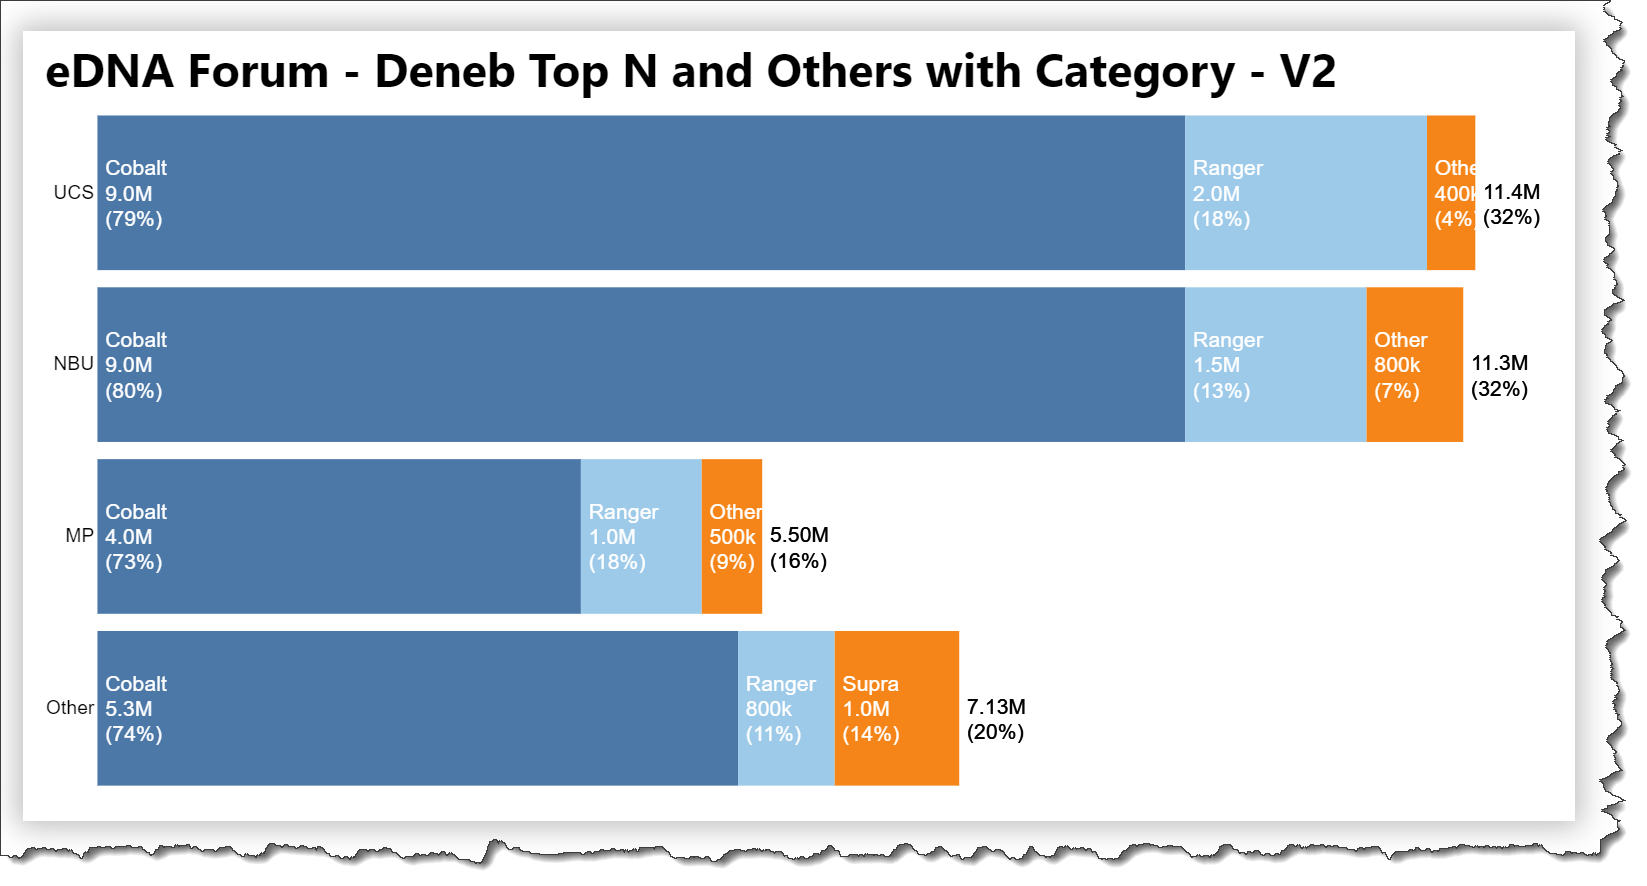
This time I started from scratch so I’m familiar with all of the code and so that all of the requirements can be addressed at once rather than the piecemeal (sp?) approach we’ve taken to date. My quick audit of all the requirements you’ve stated at various points in this and previous posts are:
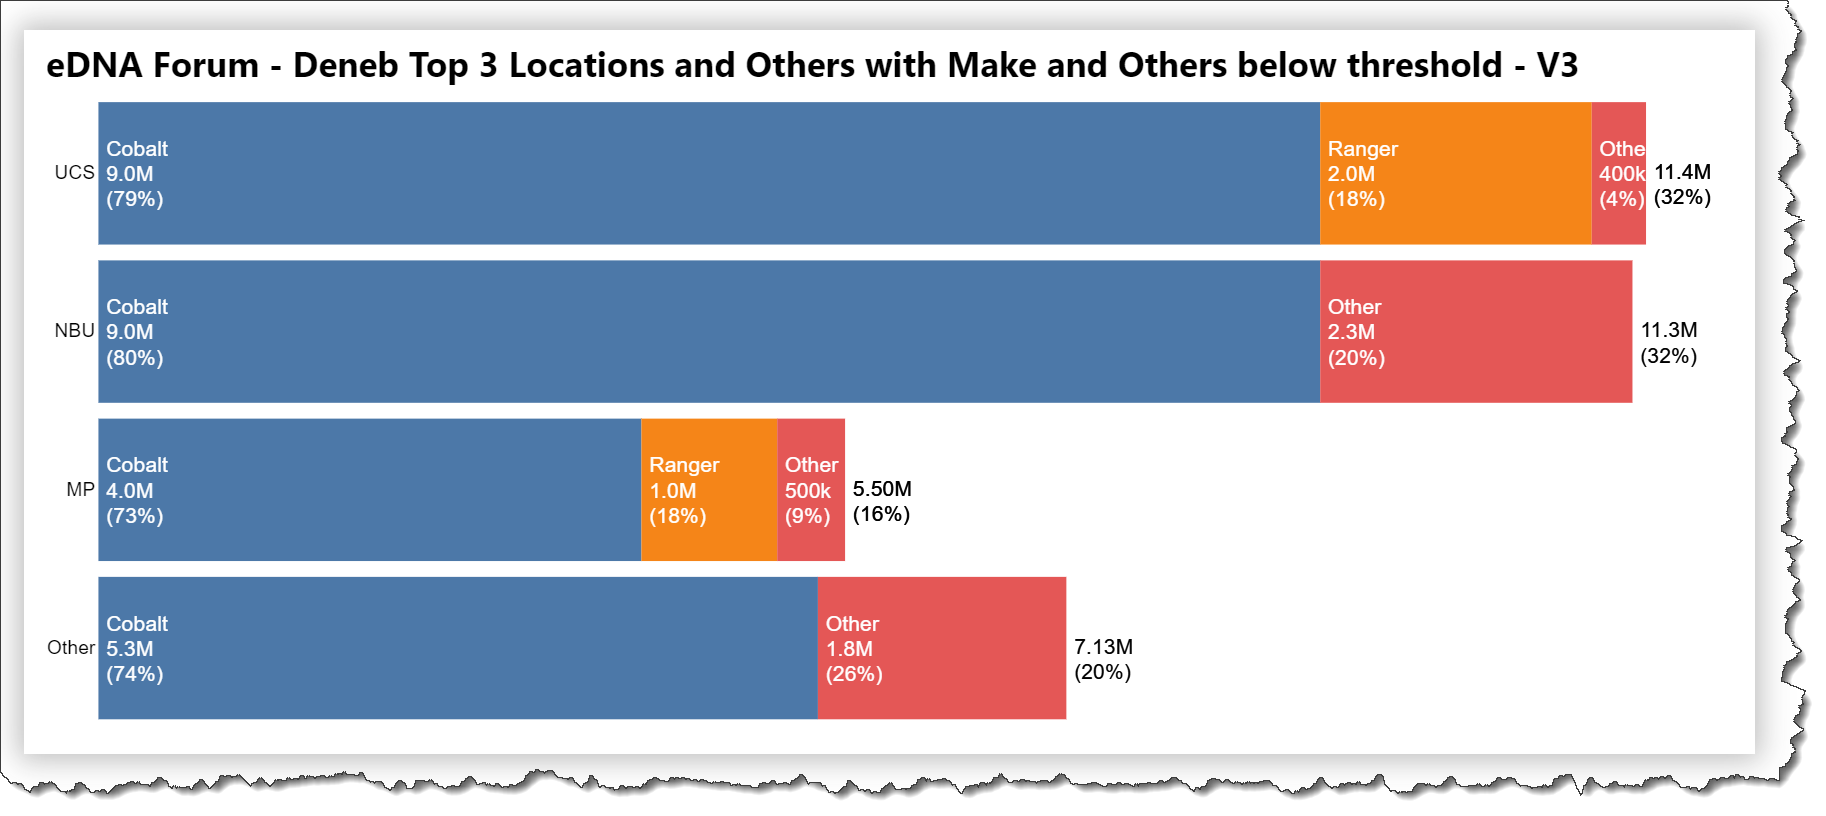
if the [Location] ranking (by total amount, descednding) is below 3, then set the [Location} name to “Other”
if the [Make] amount for a location is below 10% of the [Location] total, then set the [Make] name to “Other”
if the length of the [Make] is more than 17 characters, truncate [Make] to 17 characters
location label: display the location total amount to 1 decimal place; show its’ percent of the overall amount in brackets below
position: at the right-end of the “location” bar
make label: display the make, the make amount to 1 decimal place below, and its’ percent of the location total iin brackets below
position: at the left-end of each “make” bar
To try to achieve this, I’ve used the following transforms (in order):
Make: truncate [Make] at 17 charcters
_location_amount: sum of location amount (use joinaggregate with raw amount by location)
_location_rank: rank of location (use dense_rank with _location_amount)
Location: if _location_rank > 3 then “Other” else [Location]
_make_amount: sum of location amount (use joinaggregate with raw amount by location, make)
recalculate _location_amount (use joinaggregate with _make_amount)
_location_rank2: rank of location (now with “Other”) (use dense_rank with _location_amount)
_location_rank3: if [Location] = “Other” then a big number (I used 999) else _location_rank2
_overall_amount: sum of all make amounts (use joinaggragate transform with _make_amount)
_previous_make_amount: amount of the previous make for that location (use the window transform with “lag” operation on the _make_amount field, group by location)
_previous_make_running_total_amount: running total of the amount of all makes for that location (previous to the current one) (use the window transform with “sum” operation on the _previous_make_amount field, group by location)
_other_threshold: 10% of _location_amount
_make_label: concatenate the [Make], the _make_amount, and the _make_percent in brackets, using “pipe” separators
Make: if _make_amount < _other_threshold then use “Other” for the [Make} name
_location_label: concatenate the _location_amount and the _location_percent in brackets, using a “pipe” separator
The dataset should now have 12 rows (4 locations with 3 makes per location).
I then used the following:
shared encoding for the Y axis (no title, domain line, or ticks); axis sorted descending by _location_rank3
layer block with:
“bar” mark for _make_amount, coloured using the “tableau20” colour scheme
“text” mark for _make_label, positioned at the _previous_make_running_total_amount
“text” mark for _location_label, positioned at the _location_amount
Notes:
I was not able to resolve the renaming of the [Make] to “Other” if below the threshold and maintain the colour scheme; I tried many options, none of which are satisfactory
e.g., there are blocks that appear in the same colour with either the “Supra” or “Other” label
(it doesn’t appear you can use a colour schema (tableau20) for makes above a threshold and another colour (grey?) for makes below threshold
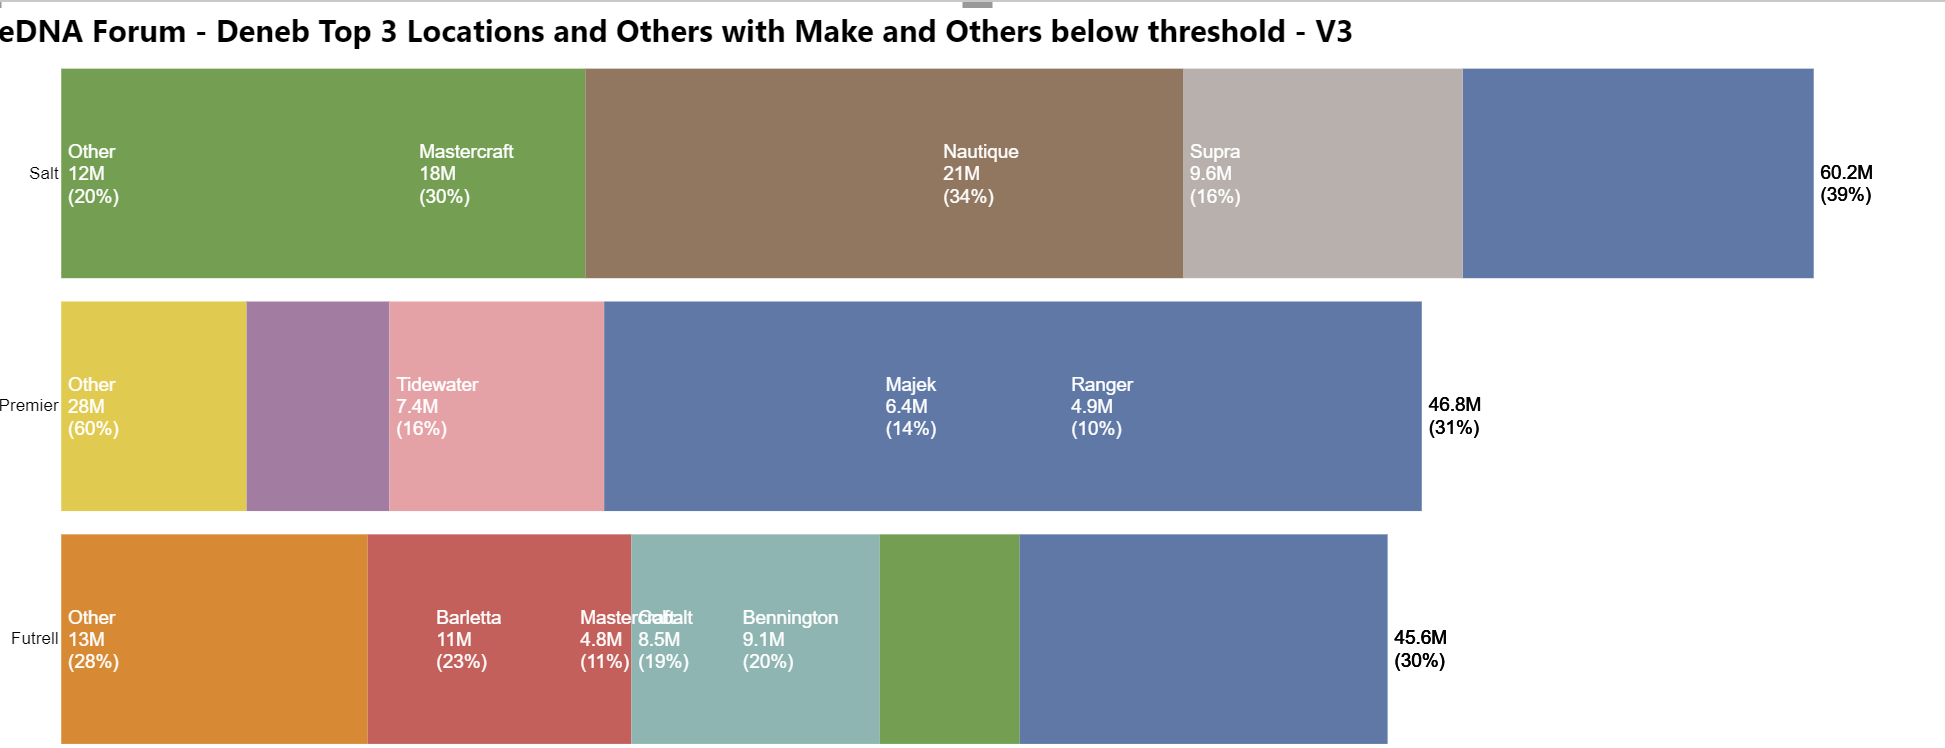
Greg, this is excellent!! Tableau20 color limitation is certainly not a deal kill. Just a few small items … BUT I totally understand this being your last pass. Absolutely do not feel any need to spend any time on this. You have been phenominal. Although the example is from a transactional sales perspective, I see greater application of this visualitzation in financial statement presentation, particular in below the line expenses by category. If you wish to further tweak, a couple small items:
the resizing limitation (650 x 340); would like the ability to resize … however.
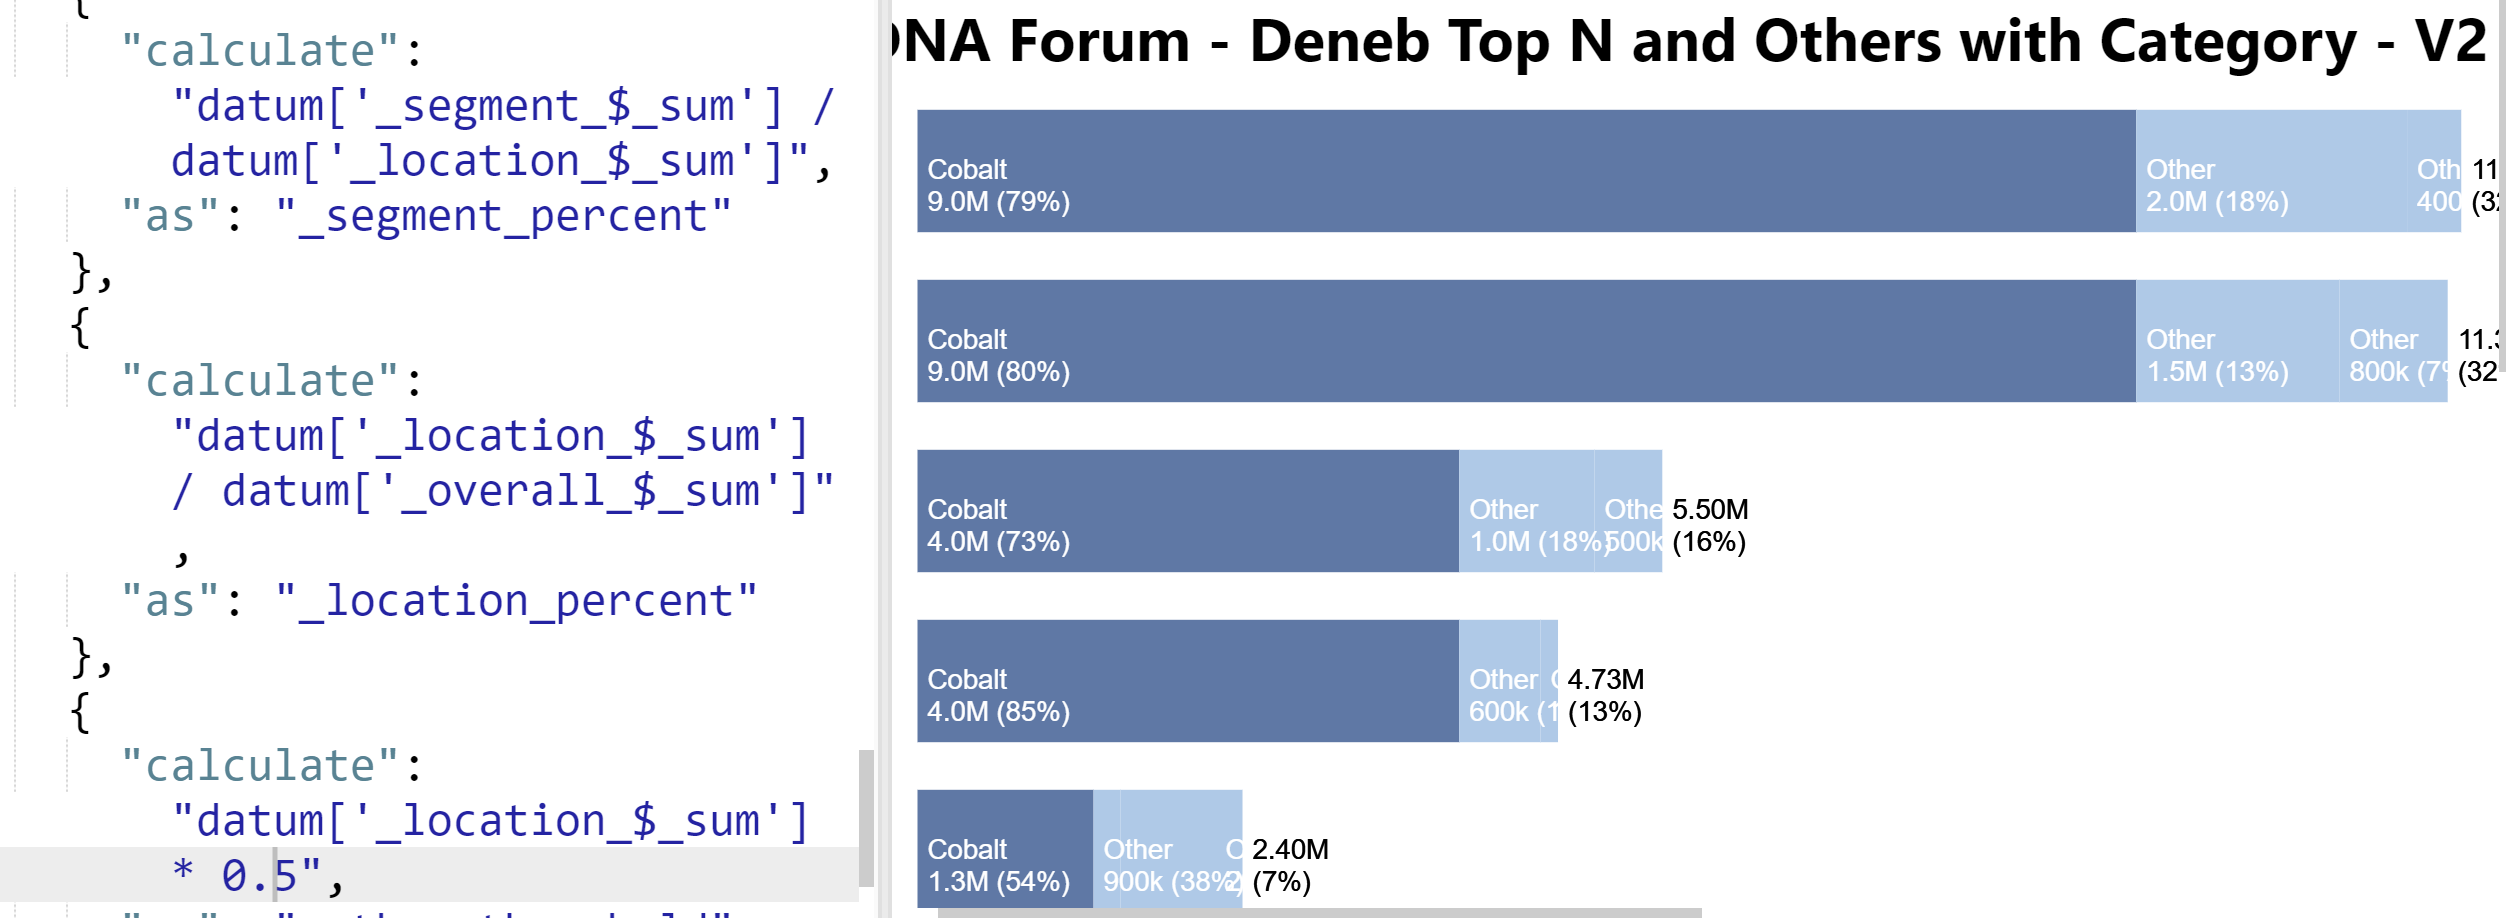
“Other” is stated multiple times within bars versus being rolled-up. See screenshot.
I’m not sure what your issue is with resizing … the V2 PBIX I attached is fully resizable:
I’m missing what your issue is. Please attach a PBIX and video/screenshot explaining your issue.
I only see 1 “Other” make in your sample data … I’ll increase the “Other” threshold and investigate alternate aggregations; pursue under separate cover and will post if I find anything.
Greg
Excellent! Nailed it!!! I’m going to add tooltips and a few other tweaks, then post my update for others. I apologize for the time involved. Thank you for sticking with me. I really like the ability to quickly change the inputs and tweak versus alternative scenarios.
Off topic, what board would I post a question regarding compensation for a possible assistant? I’ve been working with a guy from India who is quite impressive. I have projects where I am interested in his assistance, but have no idea where to go regarding remuneration. Obviously, he is not “local”, just looking for a fair plan.
It is discouraged to add new questions to an existing thread where the original issue(s) have already been solved. Rather, please mark the existing thread as solved and create a new thread for new questions.
@EnterpriseDNA, please split this thread starting at the post above this one into its own thread.
@lancemillercpa98, please mark each of your 3 recent threads as solved.
With regard to your new issues, in your new thread, please attach the work-in-progress PBIX file with sample data and a screenshot (perhaps create in PowerPoint?) of your expected outcome.