i have a question regarding what may be the best approach to add in another level of hierarchy into a Division structure to assign branches to a region level.
The context is we have in our company regional managers that are responsible for a set of branches within a division. The organisation divisional structure in the source data is site/branch/division. The region structure is not defined in the heirrachy but is does exist in the org structure
I need to add in another level where i can group branches into regions and then use these grouping to slice the data.
what i would do is to create a Division table with branch item in it. Division table will have relationship with branch item with the branch item in the raw data. This way you will have flexibility if a new division or branch is created. you will only have to update the one table.
I hope this makes sense.
Its just a thought, there is likely other solutions that people have more experience using power bi than me.
I would say how you develop the hierarchy depends entirely on what you wish to do with that hierarchical information. If all you want to do is hierarchically slice, you can just include the region field information in one of your dimension tables (perhaps an Employee table).
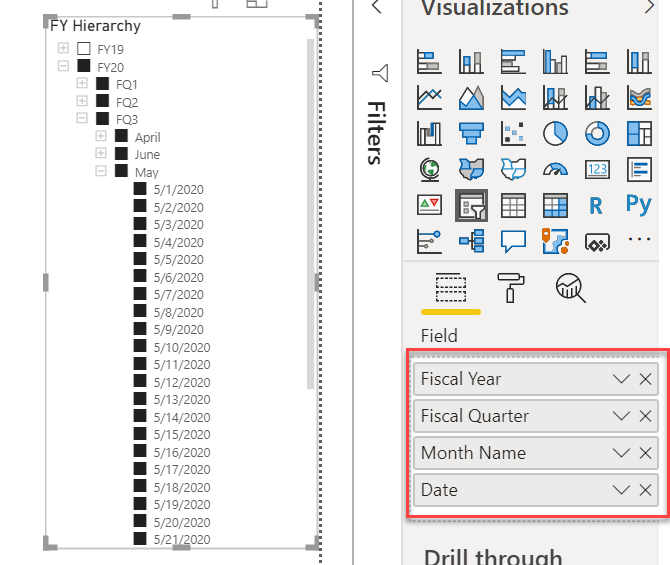
You can then develop the hierarchy on the fly, by dropping the region, division and branch fields into the slicer in exactly the way I created a fiscal year hierarchy in the slicer below:
However, if you want to analyze that hierarchical information in DAX and/or PQ, you will need to formally create the parent/child hierarchy in your data using the PATH structure.
Thanks Brian, but i think that may not work as the Region is not a field in the source data. I know what the regions should be so i can create a table with one column listing each region e.g Northern, Central Southern etc, however i want to be able to link the branches that belong to each region somehow so then the regional managers can filter on the region name and only show the data for the branches that belong to that region. Currently there is no relationship in the fact table to do this
I think to be helpful at this point, I’ll need to look at a sample PBIX file. If your data contains confidential information, here’s an easy way to anonymize it so you can post it on the forum:
Create a Region Table ( you can create this in excel and then load into power bi)
Within the Region table you will have two columns
Region
Branch
you will have multiply lines for Central regions representing each branch within the central region
Column 1 (Region) Column 2 (Branch)
Central Branch A
Central Branch B
Northm Branch C
North Branch D
South Branch E
etc
( you can have Branch in Column 1 and Region in Column 2)
You have Branch within your main data correct.
Once you create the Region table created within Power bi. you can set up a relationship between the Region table and Raw data Table within Power Bi using the Branch item in each table.
Hi @AoakeP, did the response provided by the contributors help you solve your query? If not, how far did you get, and what kind of help you need further? If yes, kindly mark the thread as solved. Thanks!
Hi Brian and Keith thank you for your help with trying to resolve my problem.
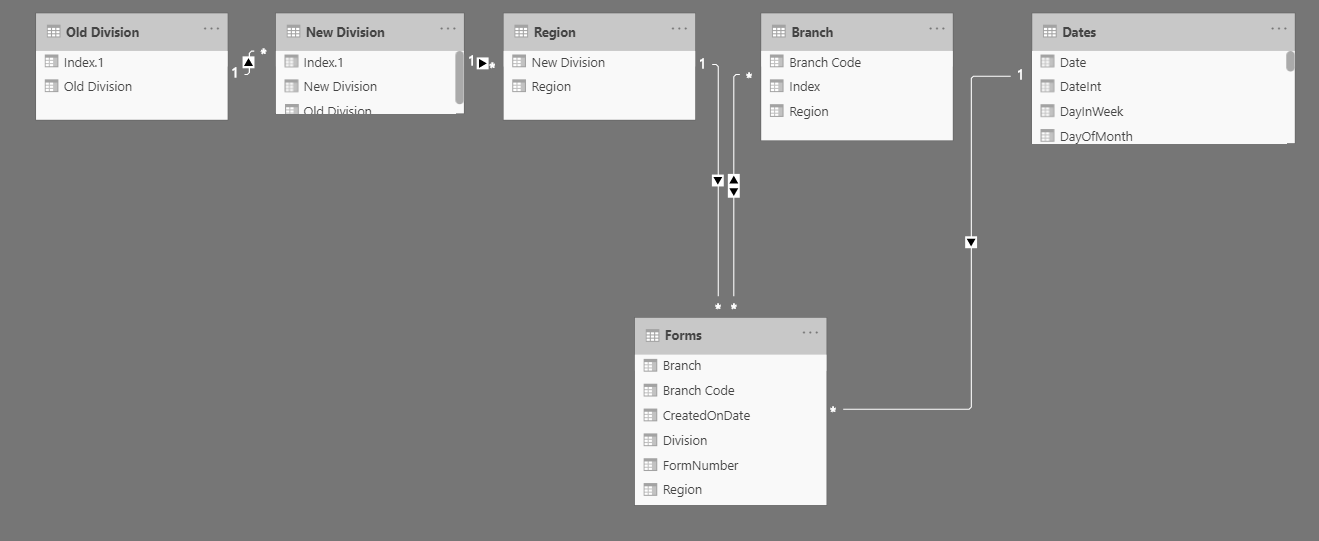
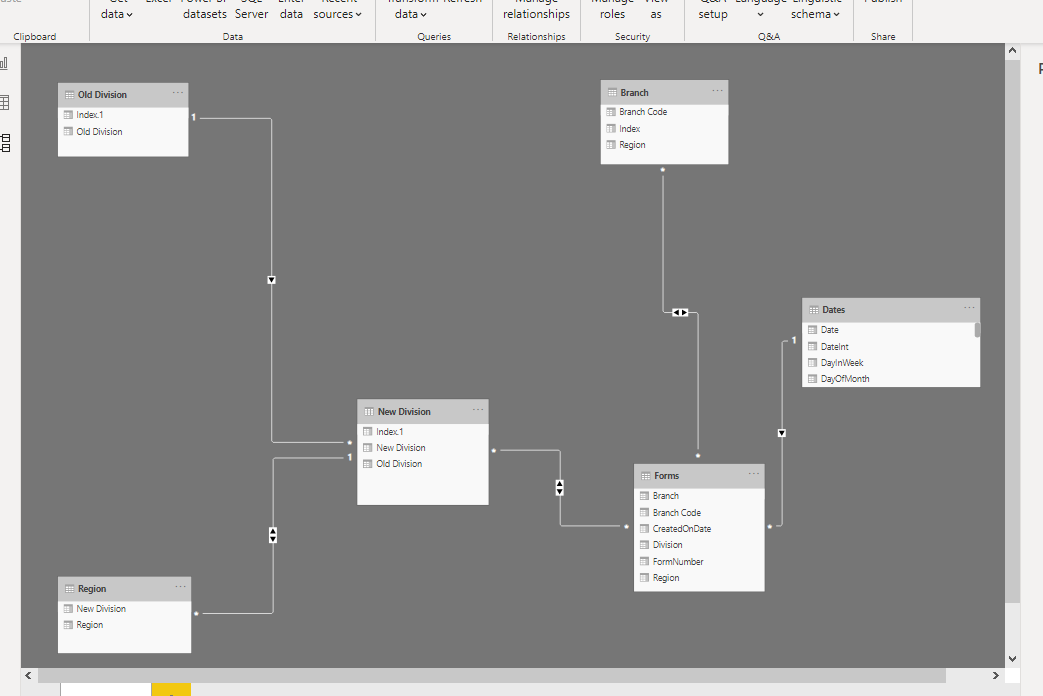
Keith I added a “New Divisions” and a “Regions” table and imported them into my model, then linked the tables how i thought it should be linked but it is not filtering how i expected.
I need the data to filter on either the Old Division or New Division or Region and the applicable fact data is displayed in the table that belong to that hierarchy.
Brian thank you for the video on masking my data, i attach a Pbix file that i have created to replicate the problem.
The data is not filtering correctly when using the slicers, it is likely the way the Organisation Heirarchy tables are linked in the Data Model but im not sure how to fix it.
Thanks very much for posting the PBIX file. Being able to dig into the details of your data model was essential in getting to the solution.
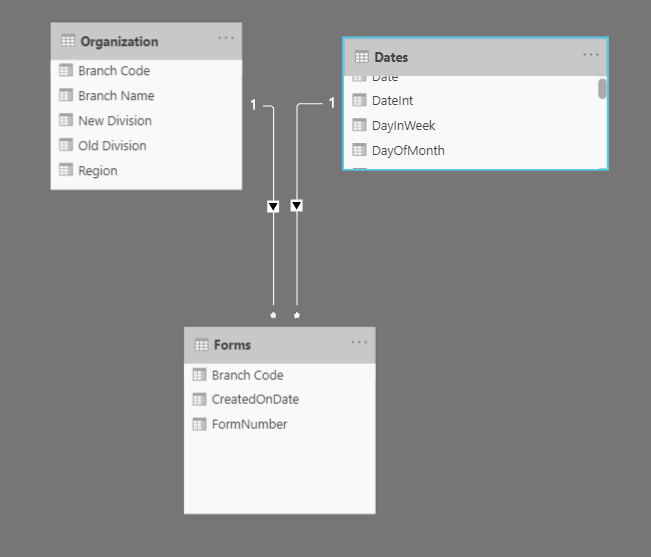
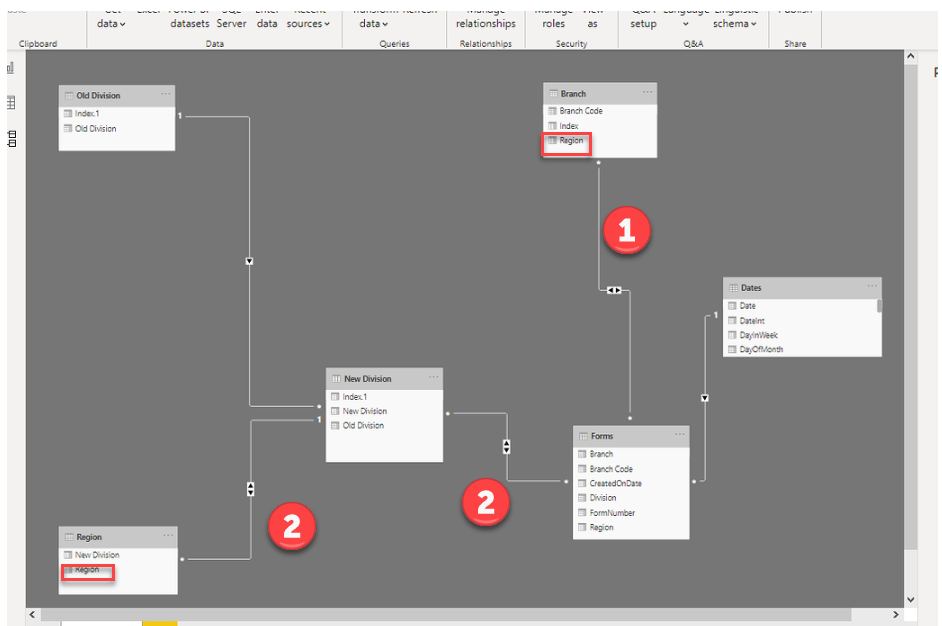
The problem with your model was twofold. Power BI is optimized for a star schema data model - single level dimension tables connected to fact tables via unidirectional, one-to-many relationships. Your data model didn’t meet either of these conditions. To conform it to a standard star schema, I collapsed the branch, region, old division and new division tables into a single dimension table (called Organization), removed the duplicates and created a one-to-many relationship with the Forms table. Here’s the old data model structure versus the new.
With these changes, the slicers now synch correctly and filter the fact table properly.
I hope this is helpful. Full solution file posted below.
If you’re interested, below is an excellent article that explains in detail why you should always strive to build your data model as a star schema:
Brian
P.S. your data was a bit “dirty” - duplicate names for the same regions and branches, some missing data, inconsistent coding, etc. I cleaned it up in order to make the relationships work properly, but you will need to check it and likely change it, since I just guessed in some cases at the correct name/code.
This structure looks problematic to me, since through the use of multiple bidirectional relationships an ambiguous path between Forms and Region has been created, which can lead to unpredictable and inaccurate DAX results.
Hi Brian and Keith, really appreciate the time you have both spent to help resolve this issue for me.
Brian i understand now that my model was flawed, i do have a gap in understanding of the Star schema’s so thank you to the link to the information on this on the sqlbi site. I also wasn’t sure if i could combine the organisation tables into the one table, i thought they had to be separate tables to be able to filter on each organisation level.
My data will need a level of clean up but essentially i can see how the relationships can be configured in the model to get the results i need.
Kevin i can see where you were going with your model and the data in the fact table probably didn’t help with being able to achieve a one to many relationship.
My example file only showed a small set of the data, i’ll apply your solution @BrianJ to my actual data set.
" I do have a gap in understanding of the Star schema"
IMO, mastering this and data modeling in general is the best investment you can make in your Power BI skills. A well-constructed data model will make your DAX SO much easier, and conversely you can be the best DAX programmer in the world and you still may not get accurate results from a flawed data model. In addition to the article I sent, I would strongly recommend going back through the Advanced Transformations and Data Modeling course.@sam.mckay does a great job explaining the underlying concepts and how to build a star schema-compliant model.
“I also wasn’t sure if i could combine the organisation tables into the one table. I thought they had to be separate tables to be able to filter on each organisation level.”
As with most things, there are pros and cons of this approach and you’ll have to judge based on the specifics of your own data model and the questions you need it to answer. However, I’ve found that in a lot of cases, combining (aka denormalizing) dimension tables is a really powerful tool to simplify your data model and efficiently synch your slicers. It does result in some duplication of information and larger file size, but the Power BI compression engine is extremely efficient and handles this denormalization quite well. It’s just a good concept to keep in your back pocket and consider when you’re building new data models.
Good luck with your project, and as always, give a shout if you run into any other problems.