At this moment, I would need help with a DAX formula related to grouping customers based on the frequency of purchase (how many months a customer buy in a Year), instead of total sales. I have been reviewing many of your videos trying to learn as much as possible about this topic, but I did not find the answer I’m looking for.
The scenario I’m dealing with is as follows:
The company wants to group their customers based on the following criteria:
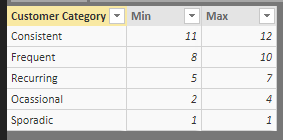
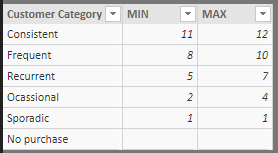
Customer Category
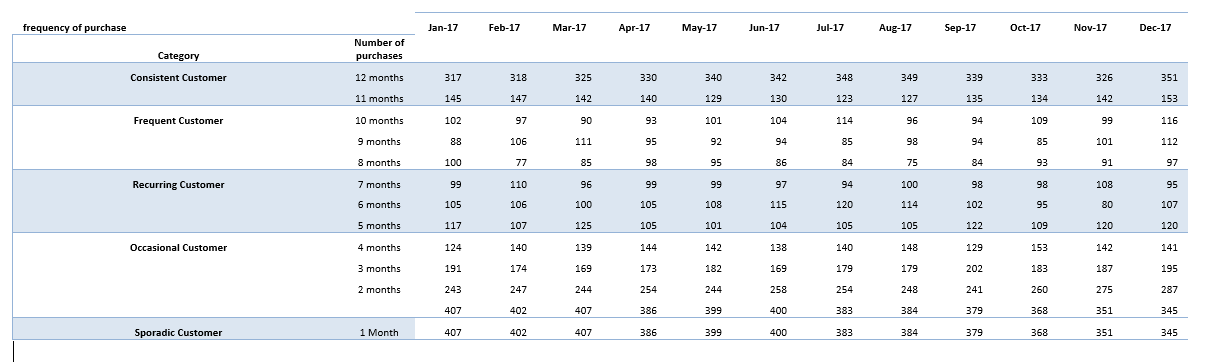
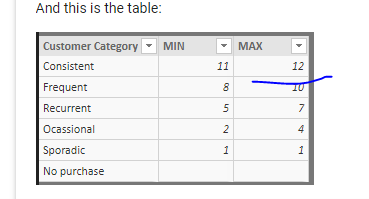
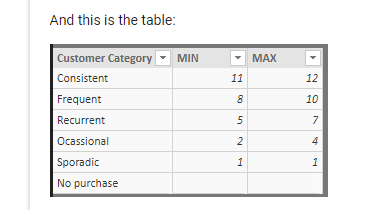
Consistent Customers = Buying 11 or 12 months within a12 month period prior. Frequent Customers = Buying 8, 9 or 10 months within a12 month period prior. Recurring Customers = Buyiing 5, 6 or 7 months within a12 month period prior. Occasional Customers = Buying 2, 3 or 4 months within a12 month period prior. Sporadic Customers = Buying just 1 month within a12 month period prior.
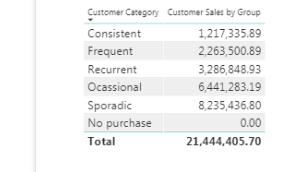
Attached you can find an example based on how they are creating the report right now. The idea is having the categories summarized by the total number of customers by month/year (including the list of the customers when selected) and of course, using PBI instead of excel
I hope you can have with this a better idea about what is needed …
Thank you so much, Sam !!! It is great learning from someone with this level of knowledge about PBI. Again, I feel blessed for having discovered you and your site
I was trying to complete this assignment following your indications but I’m still struggling with what exactly want to accomplish.
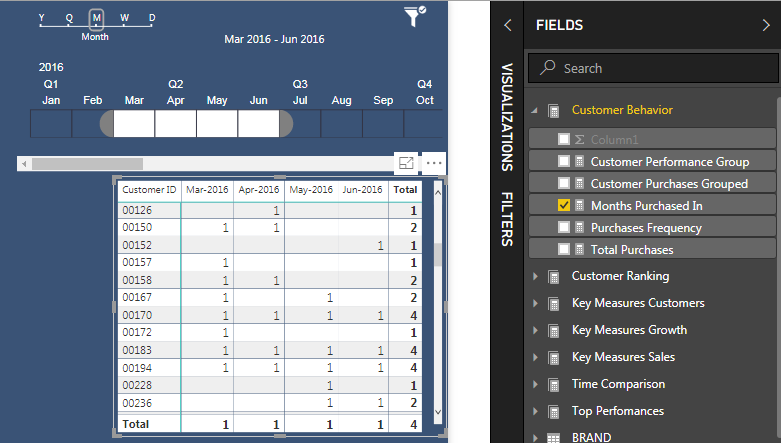
What I would like to do now is grouping the customers iteratively in time, to see their performance by months. The idea is assigning them a category based on the numbers I got after creating the measure of months purchased in:
Based on this, a customer can be changing its category through the time. My first question is if this supporting secondary table would be the correct one to achieve that.
I reviewed again your video regarding the Secondary Table Logic Technique, trying to follow the steps to make work the visuals, but my effort has been in vain … For some reason, it seems like it is not working properly the way did it
The key learning here is the context of this particular calculation is quite different to the last one, because now you want to look at each individual customer.
Really diving into what each context is for any calculation is very very important.
So first I want to setup the table correctly and try to imagine what needs to happen for every individual calc in the matrix.
Theorectically at every result we need to work out which group a customer is in looking back 12 months. Then assign the group.
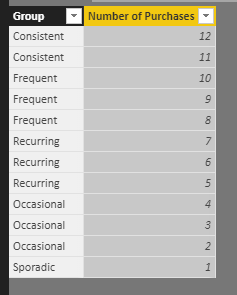
You are correct with the secondary table you’ve created.
First though we need to work out the actual result before we then allocate the appropriate group.
We need to look back a year in every result so we need a formula like this
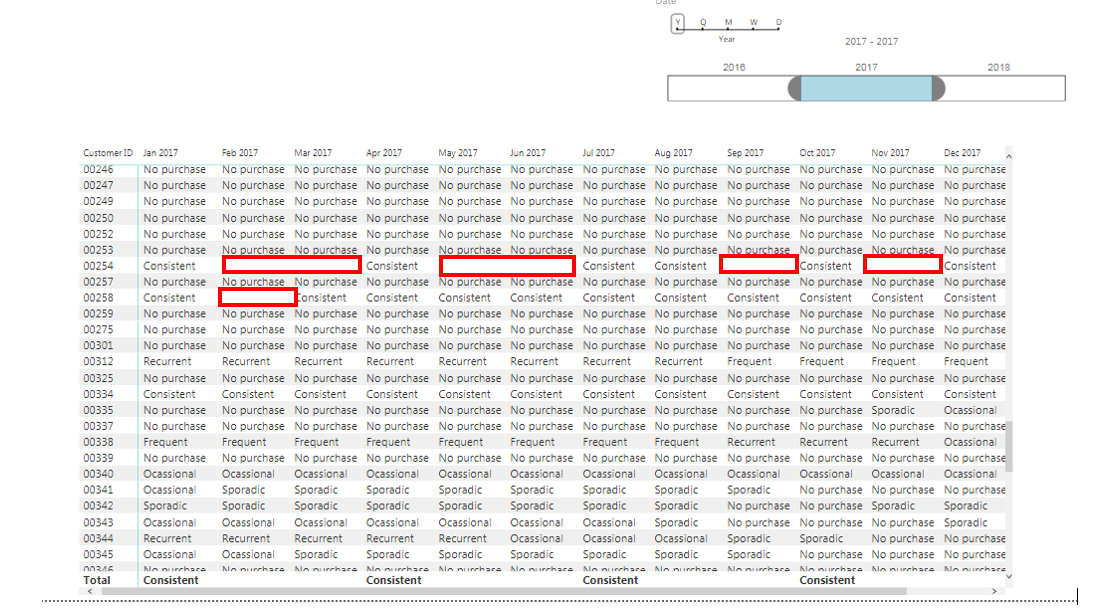
Additionally, I added to the secondary table a category called “lost” for those accounts without activity for one year back since the company considers a lost customer those who don’t purchase from them within a period of 12 consecutive months. Better than expected.
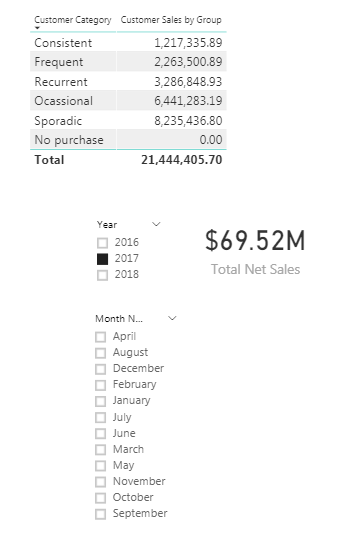
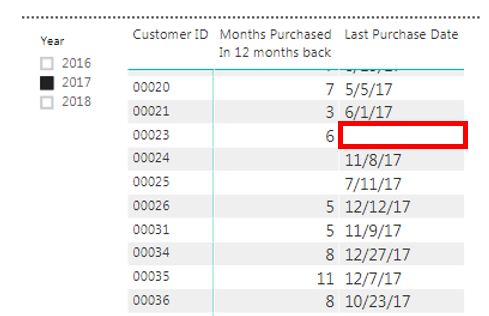
Apparently, everything was working fine with the formulas and categories, but after a further review, you can see that there are months where I got blanks instead of the category.
I believe that’s the reason why I’m not getting the correct sales amount for each category. For 2017 the total sales are $69.52M but are not matching with the sum of the categories.
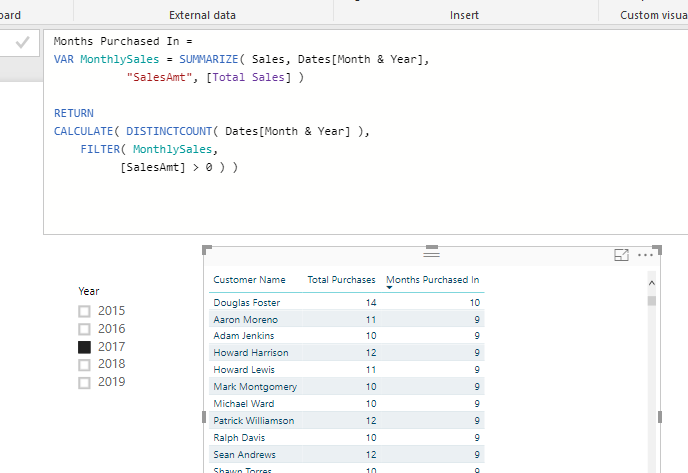
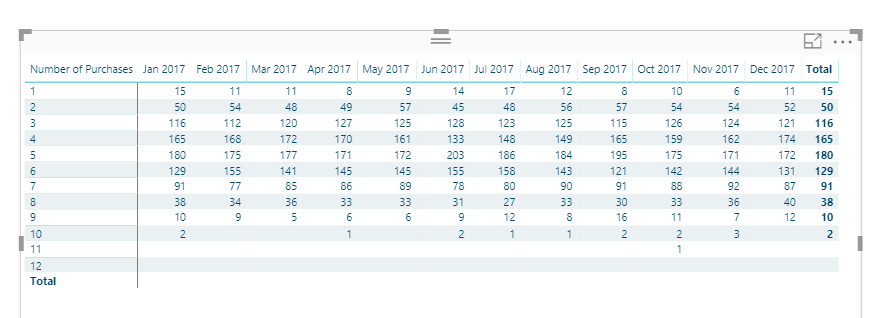
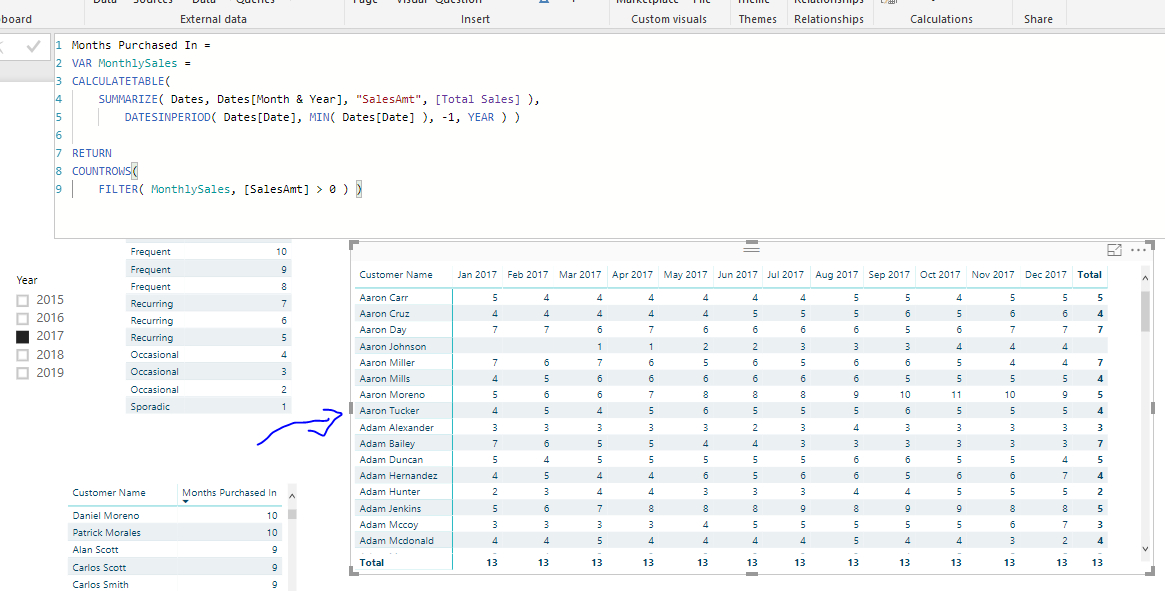
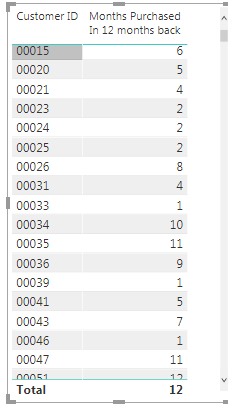
Regarding the table, the ranking is not based on number of customers. The table has been created to assign to customers a category based on the number of months that each particular customer purchased in within the previous12 months from the date selected. The formula I used to know how many months they purchased in is the following:
    Months Purchased In 12 months back =
    VAR MonthlySales =
    CALCULATETABLE(
        SUMMARIZE( 'CALENDAR', 'CALENDAR'[Month & Year], "SalesAmt", [Total Net Sales] ),
            DATESINPERIOD( 'CALENDAR'[Date], MIN( 'CALENDAR'[Date] ), -1, YEAR ) )
    RETURN
    COUNTROWS(
        FILTER( MonthlySales, [SalesAmt] > 0 ) )
This is the result I got from the calculation:
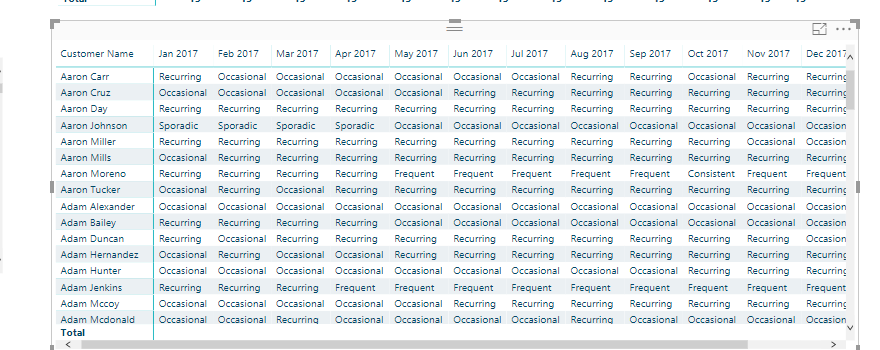
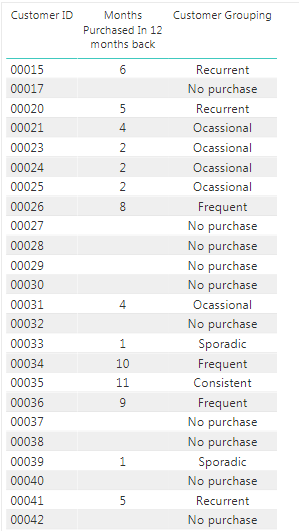
From the numbers I got in the Months Purchased in 12 months back table, a category has been assigned to each customer based on the ranking table created …
I saw your videos Dynamically group Customers by Ranking; Dynamic Grouping via support tables; grouping via lookup table logic and grouping via calculated columns but still I haven’t been able to resolve my issue.
I feel I’m close on what I need, but still, I cannot find the proper formula to achieve it since my knowledge about DAX is still kind of limited
I was able to get the counts of months that I need for the 12 months back and also the categories associated to those counts, but there is still the final step missing in my calculation.
Months Purchased In 12 months back = // Number of months that each particular client purchased in within the last 12 months from the date selected.
VAR MonthlySales =
CALCULATETABLE(
SUMMARIZE( 'CALENDAR', 'CALENDAR'[Month & Year], "SalesAmt", [Total Net Sales] ),
DATESINPERIOD( 'CALENDAR'[Date], MIN( 'CALENDAR'[Date] ), -1, YEAR ) )
RETURN
COUNTROWS(
FILTER( MonthlySales, [SalesAmt] > 0 ) )
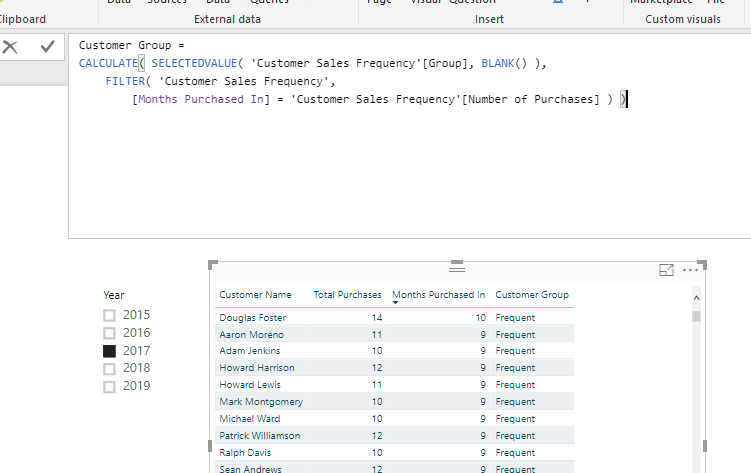
Customer Grouping =
CALCULATE( SELECTEDVALUE( 'Customer Grouping'[Customer Category] ),
FILTER( 'Customer Grouping',
[Months Purchased In 12 months back] >= 'Customer Grouping'[MIN] &&
[Months Purchased In 12 months back] <= 'Customer Grouping'[Max] ) )
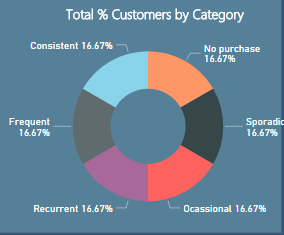
Now, I would need to find the formula to dynamically group those categories based on the total number of customers for each of the categories. That is, how many of those customers are within every category during the period selected, taking into consideration that “Months Purchased in 12 Months back” and “Customer Grouping” are both measures, not calculated tables …
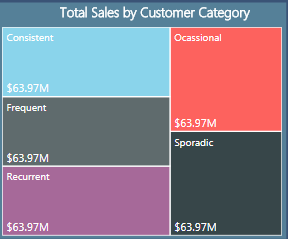
Yes, that is giving me the total sales by category, but now, I have a problem … Since I’m calculating the number of months a customer purchased in for the past 12 months, I have cases like customer 23 that since the date of the last purchase was on 2016 I’m getting blanks if I select, for example, 2017.