Hi, I have a simple data table as follow:
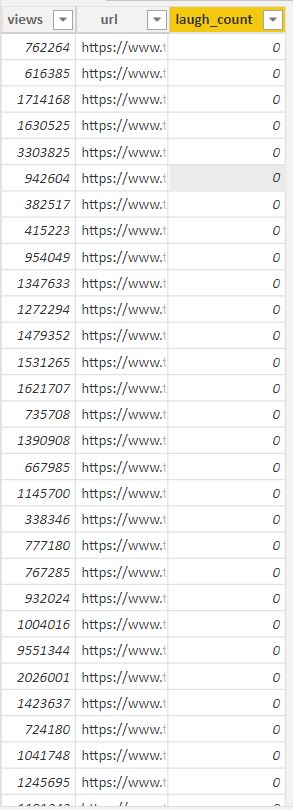
Each row represent one unique “URL” for one Video, “laugh_count” is integer from 0 - 20, “views” vary depending on videos.
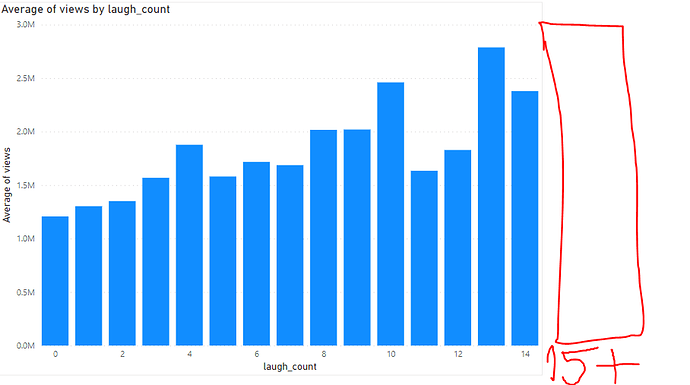
I want to create a simple bar chart column with Average Views group by number of “laugh_count”, for “laugh_count” values of 15 and higher I only want to show only 1 column, averaging views for any videos with 15+ laugh_count.
How can I do this? Thanks for your help!

