But its grouping all of my customers in the first group.
I adapted the formuale from one I was using to rank by customer into top 5 etc, so I guess I need to take out the rankx elements- is this teh best way to do it?
Thanks
Rob
How do you want to group your customers? Do you want a group name for each of those “Groups” you have in your column, or do you want to Rank them? Do you want this implemented into the table, or is it ok to be in a separate measure. If you want to group like all customers <150K, 150-300K & > 300K, then a SWITCH statement would be your best bet. Also helps us out if you are able to post a sample PBIX file.
Yes it certainly would help a lot more to have a demo file and or Seeing more about how you have your model set up and also how you intend to utilise this formula and a visual.
Just want to also confirm have you gone through this particular video here because it shows you exactly how to group your customers by ranking.
Seeing more about how you have your model set up and also how you intend to utilise this formula and a visual.
Just want to also confirm have you gone through this particular video here because it shows you exactly how to group your customers by ranking.
The clear issue here for me though is that your table is trying to group by total income but then within your formula you have some ranking methodology. So that’s why everyone’s going in the first group because everyone is under the 25,000 with their rank. So I think you need to work out exactly how you’re trying to group because it’s not matching up between the table and the formula
Hi,
I have about 150 key customer accounts, and I want to group them in the different income groups, to help identify how many customers we have in the different groups if that makes sense?
The model is quite complex, but’ll try and adapt a test model and post.
Hi Sam,
Thanks- I’ve used that video and do use ranking as well to show customer data, I have just had a request though to show the customers in income groups rather than by top5, 6-10, etc.
Regards
rob
Do you really need that many groups? If you do that is fine, just asking because in many cases you would do a wider ranger for each category. So in total would only need 3-4 groups at most.
A possible solution would be to use a SWITCH statement. Here is some info to review on that.
Just to clarify, is this a table that you have in your model that we need to base the solution off of, or is there another column or measure that brings back the # that meets the criteria in the table shown.
Hi,
Ive used the Switch true statement to create my PL and Balance Sheet, but not sure how I would use here?
I have a customer table plus measures for annual sales, so separate one for 2020, 2019, etc. I wanted to then split that income then across the income groups.
Thanks for all the help.
Rob
This thread might be helpful. It’s focused on grouping by rank using a SWITCH statement, but the measure could easily be revised to group by income - basically just by building the income group boundaries in the VAR section of the measure (rather than the rank group boundaries).
I don’t want to step on @JarrettM efforts to work through this with you. I forwarded the above thread in hopes that it might provide a quick, easy answer, but given that it didn’t, just ignore and I’m sure Jarrett will provide you with a great path forward.
Thanks for your pointers guys, I went over one of the videos and adapted the formulae to:
Customer Sales by Sales Group £ =
calculate ([Total £ Sold],
FILTER(values(‘Stoves’[Name] ),
COUNTROWS(
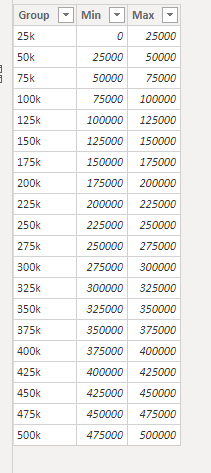
FILTER(‘Income Groups’,
[Total £ Sold] > ‘Income Groups’[Min] && [Total £ Sold] <= ‘Income Groups’[Max] ) )
>0 ) )
Which has given me the results I need.
Once again- thanks for the pointers!
Regards
Rob
Hi @robH, a response to this post has been tagged as “Solution”. If you have a follow question or concern related to this topic, please remove the Solution tag first by clicking the three dots beside Reply and then untick the checkbox. Thanks!