Graph Year and Month

Hi,

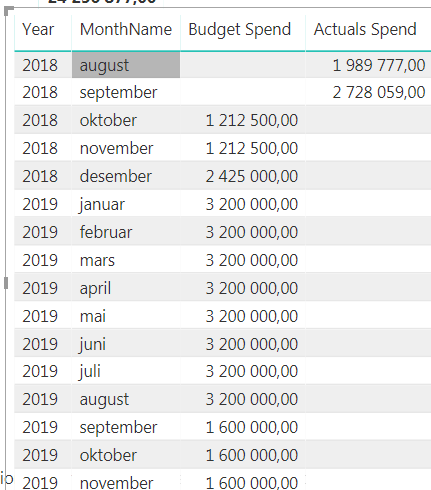
Please find Attached file. I want to use a graph showing numbers by month. But since the Budget is showing two times (oct, nov and dec for both 2018 and 2019) the graph dosent show the correct numbers. Any way to go around that problem? It should be a separate lineGraf

Thanks.

/H

Probably going to need to see more here. I’m not really sure of the answer looking at this currently.

Can you show an image of the underlying table and also the model you have?

Looking at your table I only see each month and year mentioned once, so I’m a bit confused about the 'two times’you mentioned.

Thanks

Hi,

If you see in the Budget column there are both November 2018 and November 2019. I want one seperate line showing 2018 and one line 2019. Otherwise it will be one line showing over the years. In that way its hard to see the difference between the years.

Thans.

Can you show me an example of what you mean.

I’m just not getting the requirement still unfortunately.

‘One separate line for 2018 and one for 2019’?

So do you mean you only want the entire years rolled up into one line. To do that, just change the context to the year in the table.

Also if you want different lines so you can see them on the same chart, then you have two options.

The first is the place the year in the legend of your chart,

Or use CALCULATE and FILTER to only pick up the amounts in a particular year.

Eg.

CALCULATE( Sales, Year = 2018 )

Thanks
Sam

Hi,

Yes, I think the last one works fine.

Thanks.