Getting the correct subtotal DAX

File location:
https://drive.google.com/file/d/1R-dIg6TEBZjEHREOmL1nSg0Lz-p1cDVk/view?usp=sharing

I need help with summarizing the correct totals. If I just multiply the two numbers together, I get the correct individual total but not grand total.

However, if I try to iterate using sumx and summarize, the values from the PY are excluded due to what I believe are the filters for only the current year.

How do I iterate and get the missing values to appear properly?

Formula without iterators:

Component Diff = 
[CY fg all lvl3] * [Ratio Difference]

@benwann1,

Thanks for posting the file. I’ll get back to you with a specific answer soon, but just as an FYI, here’s a technique I’ve found really useful in diagnosing complex filter context problems, such as yours:

  • Brian
1 Like

I updated some of the formulas.

The problem remains that volume variance_2 subtotal doesn’t add up and I’ve exhausted every combination of ideas that I can think of to resolve it. I feel that it needs a slick line of DAX that I can’t conjure up.

https://drive.google.com/file/d/12vdJ4POAhMhUCRdmvk5Dn4BNq-N3jo74/view?usp=sharing

@benwann1,

OK, I can see why this one has been giving you so much trouble. The concept seems simple - just apply the Component Diff measure to each row, and then add a logic check so that if it’s the total row, sum the column. However in practice, two big problems - the filter context is nightmarishly complex to untangle and because of the nature of the summarization, HASONEVALUE doesn’t work as the logic check for the total row.

I’ve been working this one hard since you posted it and I think I’ve got the measure working properly, but there’s a weird quirk in the visual that I haven’t figured out yet. Wanted to share it with you now before things get even more confusing with the revised data set.

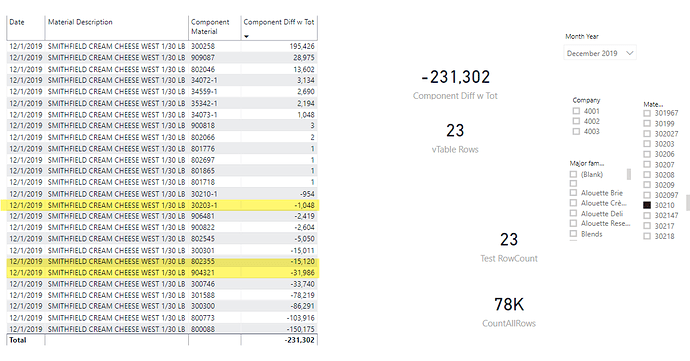
Here’s the measure, and I’ve checked it pretty extensively both via COUNTROWS() of the virtual table, as well as actually filtering the data itself based on the slicer values, exporting it to Excel and checking the totals.

Component Diff w Tot = 

VAR vTable =
CALCULATETABLE(
    ADDCOLUMNS(
        SUMMARIZE(
            'All data new',         
            'All data new'[Material Description],
            'All data new'[Component Material]
            ),
         "CmpDiff", [Component Diff]
    ),
    ALLSELECTED( 'All data new'[Material], 'All data new'[Material Description] ),
    ALLSELECTED( 'Date Table'[Month Year] ),
    ALLSELECTED( 'Plt Company'[Company] ),
    ALLSELECTED( 'All data new'[Component Description] ),
    ALLSELECTED( 'All data new'[Component Material Type] ),
    ALLSELECTED( 'Mat Analyzer'[Major family desc] )
)

VAR TotalSum = 
    SUMX(
        vTable,
       [CmpDiff]
    )
  
VAR Final =
SWITCH( TRUE(),
    ISINSCOPE('All data new'[Material Description] ), [Component Diff],
    TotalSum
)

RETURN
Final

So far, so good. Now here’s the weird quirk in the visual I haven’t figured out yet. The three highlighted rows don’t actually exist in the data set for December 2019 (the selected value in the slicer). Interestingly, if you go into the filter pane and try to select the component material for the three highlighted rows, they’re not there either (as they shouldn’t be). I checked the visual interactions, and they seem fine - it’s almost as if the visual is just rendering improperly.

Other than that however, it seems to be working fine. Give this a review, and let me know how you’d like to proceed from here.

Hope this is helpful. I’ve attached a Google Drive link to my full solution file (too big to post directly on the forum), as well as the Excel file I used to check the total.

1 Like

Fantastic work. I am looking into everything now. The three materials highlighted should be there.

One of the reasons that this model is so complex is to meet the business requirements that the comparison be done on the material/component level for items used this year and last year and to also account for substitutions where we used a different material this year than last year but the type is the same. For example, we can change the film supplier, but we need to get to an equivalent comparison on items that are seemingly unrelated.

I will share my further observations and comments later today. Again, thank you, Brian!

Ben

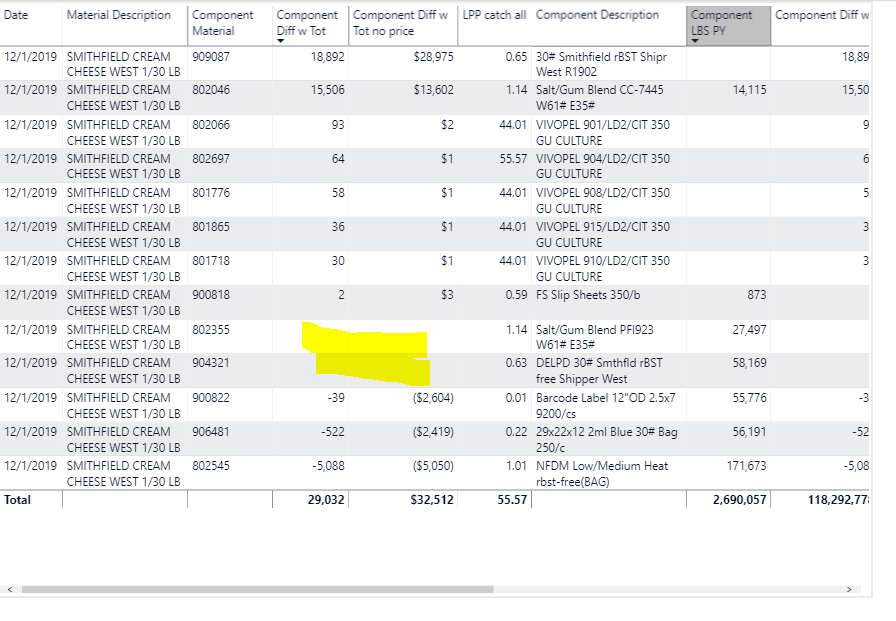
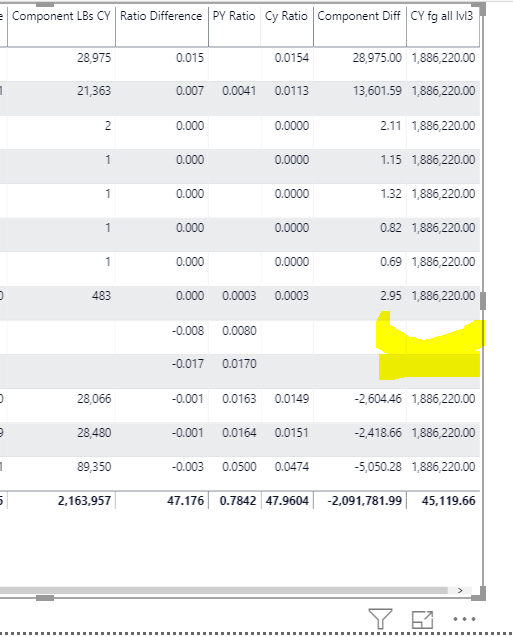
There is just one final piece now. The formula CY fg all lvl3 is now not filling in for every visible row and is thus not including py amounts in the calculation.

Any thoughts on this one? I tried about 15 combinations and couldn’t crack it.

New file with comments:https://drive.google.com/file/d/1aJ9jsvXsJuuvIyxZIueCC16APzfXtCrq/view?usp=sharing

@benwann1,

Great – glad to hear the last measure is working well. I’ll take a look at this new problem and see if we can’t nail down this final piece soon.

Thanks very much for posting your PBIX files and providing such a clear explanation of your problem - makes it much easier to provide support.

  • Brian

P.S. I’m still pretty dumbstruck that the most complex data model I’ve seen on this forum to date is in support of the production of cream cheese…

@benwann1,

I think the wrong suspects are in custody. I believe the problem is not that the measures are not filling in for every visible row, but that the problematic visible rows don’t belong there in the first place, since they don’t meet the filter conditions defined by the slicer values. Thus, the measures are behaving as expected, i.e., returning blank values for those rows not meeting the filter conditions. Here’s the evidence - if you go directly to the table view and filter the full 2019 table based on the filter criteria of:

Month Year = December 2019
Material = 30210
Company = 4002

the blank rows in your visuals do not appear in this filtered data set, because the dates of these records do not correspond to December 2019:


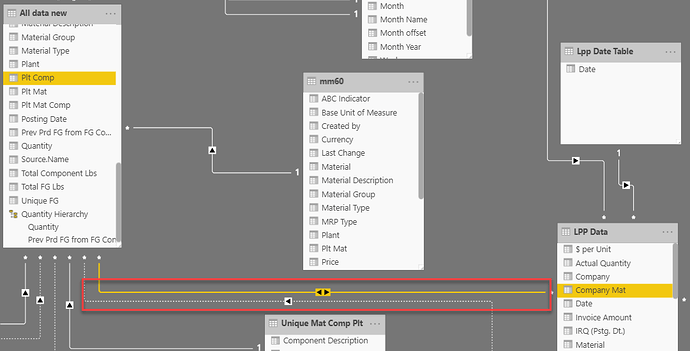
I have a pretty strong suspicion that the actual culprit is this bidirectional many-to many relationship, which may be causing ambiguity in your data model, leading to the violations of filter context in your visual.

There are many different ways to get around this problem. The one I would try first is rework your data model, inserting a common dimension table that filters both tables at the current endpoints of your bidirectional relationship, via two new unidirectional one-to-many relationships (if you have the current version of the Definitive Guide to Dax, there’s a great explanation of this approach starting on page 500). You can create the common dimension table easily in Dax via the following code:

PltCo Mat Comm Dim Table = 

DISTINCT(
    UNION(
        DISTINCT( 'All data new'[Plt Comp] ),
        DISTINCT( 'LPP Data'[Company Mat] )
    )
)

Alternatively, there are Dax-only approaches using CROSSFILTER or TREATAS that will also allow you to get rid of the active bidirectional relationship.

https://forum.enterprisedna.co/t/creating-virtual-relationships-using-treatas-advanced-power-bi-technique/2937

I also noticed that some of your measure totals are incorrect. Hopefully, the work we did yesterday on the Component Diff w Tot measure provides you a good roadmap for fixing these as well.

I hope this is helpful.

  • Brian
2 Likes

Hi @benwann, a response on this post has been tagged as “Solution”. If you have a follow question or concern related to this topic, please remove the Solution tag first by clicking the three dots beside Reply and then untick the checkbox. Thanks!