Hello,
Recently I posted a thread about visualising my data in the form of an individual value plot. After a lot of talking (and @BrianJ inadvertently nudging me along ![]() ) I sat down this afternoon ready to take the plunge into the deep dark waters of the unknown - R. Not only R, but R and power bi.
) I sat down this afternoon ready to take the plunge into the deep dark waters of the unknown - R. Not only R, but R and power bi.
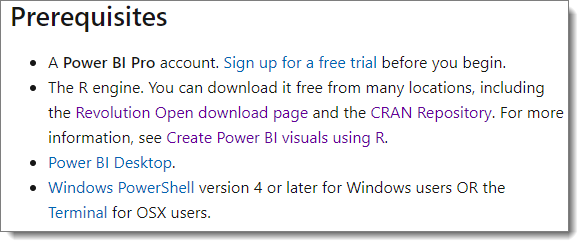
In the Microsoft tutorial Create an R-powered Power BI visual it lists these prerequisites:
Question 1:
Is it true that you can only use R visuals if you have a power bi pro account?
Question 2:
Edit: Not to worry, I found the answer here
There are two versions of R to choose from, the Microsoft flavour (Revolution Open download page) and then the normal flavour - from CPAN. Does it matter which one I choose? And if so, what is the difference?
Question 3:
Not that I know anything about R (yet), but I’m guessing I’m going to need an IDE. Does anyone have any strong preference as which to use? Or it as obvious as just going with R-Studio?
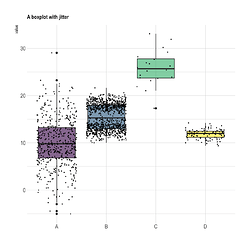
Now, after a lot of dithering, I found two strong candidates for my individual values plots.
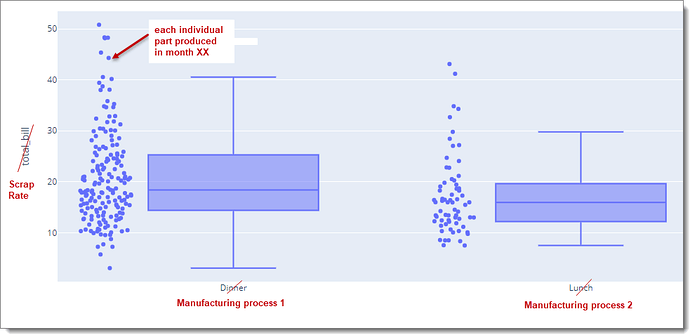
- Use R, and a boxplot from the R plotly package
(the pic actually comes from the python plotly package but the same seems available for R)
Or,
Question 4:
Since I cannot find the hrbrthemes library in the official list of supported R packages for power bi. Is it safe to conclude that (2) is in fact then not an option for me?
Question 5:
I am obviously hitting analysis paralysis here in my procrastination to jumping into the water. Does anyone who has trodden this path before me, have a nice gentle tutorial to get me to the point where I can visualise (1) or (2) above? As in, what to install for R. How to install the packages. How to get it into power bi. How to connect to my data model.
Sorry to ask for so much support here, but I am becoming more and more daunted by this exercise.
Looking forward to a reply
Michelle
