Getting last week (shift specific) data to display in a table

PAS Analytics - V2-7-reduced.pbix (3.2 MB)

Hi, I would like to get last week (shift specific) - 48 hours of data to display based on shift selection that I had made in a table visual.

This is for detail data comparison in 2 tables.

How to achieve it ? I tried the Dax query, but it’s not working. (see attached details data and selection)

For example :
1- when I select shift = 2019/04/30 6 AM - 2 PM
then I need to grab 24 hrs of data (end shift time) for shift = 2019/4/23 6 AM - 2 PM

Ok the first thing here never work with date and time columns.

What you need to do here is break out these column into one being date, and the other being hours.

This way you can then start using all the time intelligence functions and you entire model just becomes more simplified.

image

Every date column should just be dates. Then if you need to review anything by times within those dates, you need to filter a different column based on the hours.

This part seems ok

image

You can extract a lot of information from your date/time columns by using these icons within the query editor.

Have a go at sorting you model better using these ideas and then hopefully it will be clearer what you need to do need.

You should be able to use a combination of CALCULATE and FILTER or even some simple time intelligence functions when you have this setup correctly.

Thanks
Sam

Thanks, I had modified the data types based on your suggestions (thank you!)

and still can’t get my DAX query to work. See below. Also attached new modified pbix file for your review.

Where I have this as a filtered data that I want to display as for LAST WEEK details - BUT still not workingPAS Analytics - V2-7 reduced-2.pbix (3.7 MB) .

**Last Week Shift Selected Detai**l = 
 VAR selectedShiftBeginTime = SELECTEDVALUE('CollectDateTime'[work_shift_begin_dt]) - 7
VAR selectedShiftEndTime = SELECTEDVALUE('CollectDateTime'[work_shift_end_dt])-7
VAR SelectedOrdersBeginTime = selectedShiftEndTime - 2
RETURN  
    CALCULATETABLE(
   Filter(ALL('CollectDateTime'), 'CollectDateTime'[Ord_Dt] >= SelectedOrdersBeginTime && 'CollectDateTime'[Ord_Dt] <= selectedShiftEndTime 
              
                 ),All('CollectDateTime'[ShiftSelection]))

I also try the SELECTCOLUMNs (with better control on columns) function… Same thing… my result set returns nothing.

Last Week Shift Selected Detail = 
 VAR selectedShiftBeginTime = SELECTEDVALUE('CollectDateTime'[work_shift_begin_dt]) -7 
VAR selectedShiftEndTime = SELECTEDVALUE('CollectDateTime'[work_shift_end_dt]) -7
VAR SelectedOrdersBeginTime = selectedShiftEndTime -2
RETURN  
    CALCULATETABLE(SELECTCOLUMNS( 
      (Filter(ALL('CollectDateTime'), 'CollectDateTime'[Coll_Dt] >= SelectedOrdersBeginTime && 'CollectDateTime'[Coll_Dt] <= selectedShiftEndTime 
                 ) )  , "AccessNumber", CollectDateTime[AccessionNumber],
                        "OrderId", CollectDateTime[OrderId]) , all(CollectDateTime[ShiftSelection]))

Hi, I also watched this video - Setting up Time dimension effectively for previous N Days display - #2 by sam.mckay

And I am not grasping the concept to solve my scenario. Need some guidelines. This is my last visual for my report needed for Friday (8/2/2019) Demo! :frowning:

for some reason , the SELECTEDVALUE() will not ‘stay’ in my sub-sequence FILTER statement.

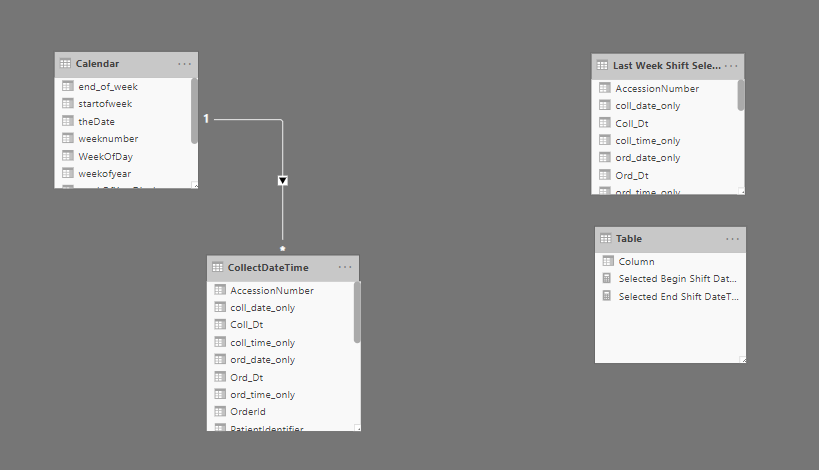
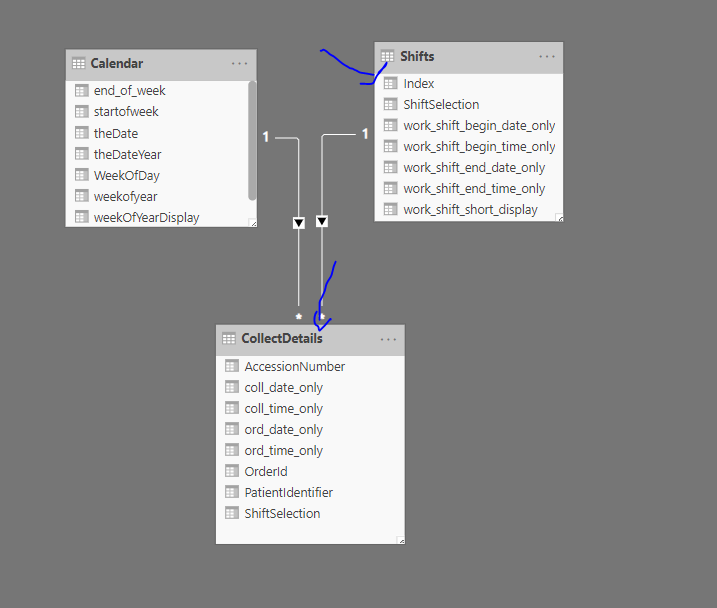
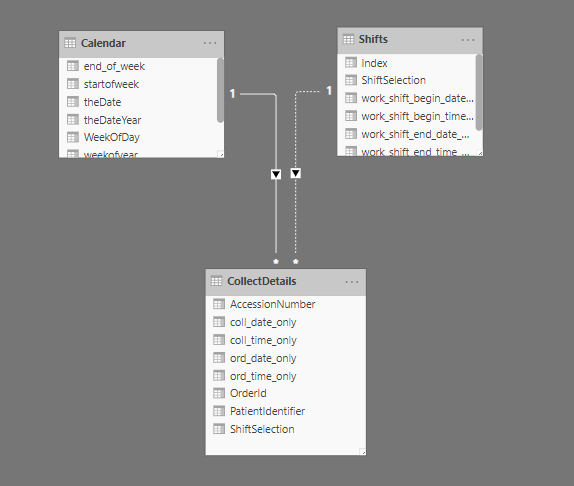
Ok first just make sure you have a handle on how you model is setup.

I looked at the example file and there were table all over the place. You need to make sure this is setup correctly and your understanding what is happening here.

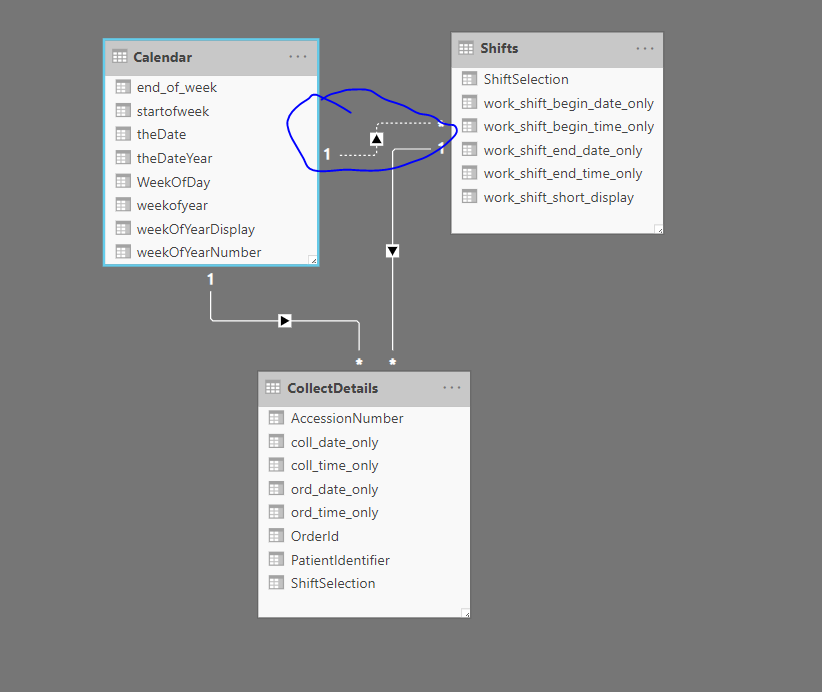
I’ve just done some small re-arranging before I go any further.

Whether this is the right setup, I’m not totally sure, but this is my starting point.

Also I’m just not sure why you feel you need to create this extensive measure table?

What is the point of it? Why can’t you just use time intelligence function and DAX to sort out all these calculations? Maybe over thinking this a little bit? I’m just guessing here, but I never have to do anything like this in any work I do.

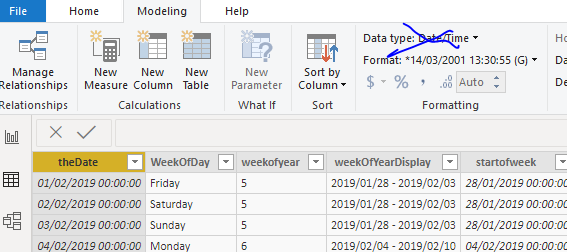
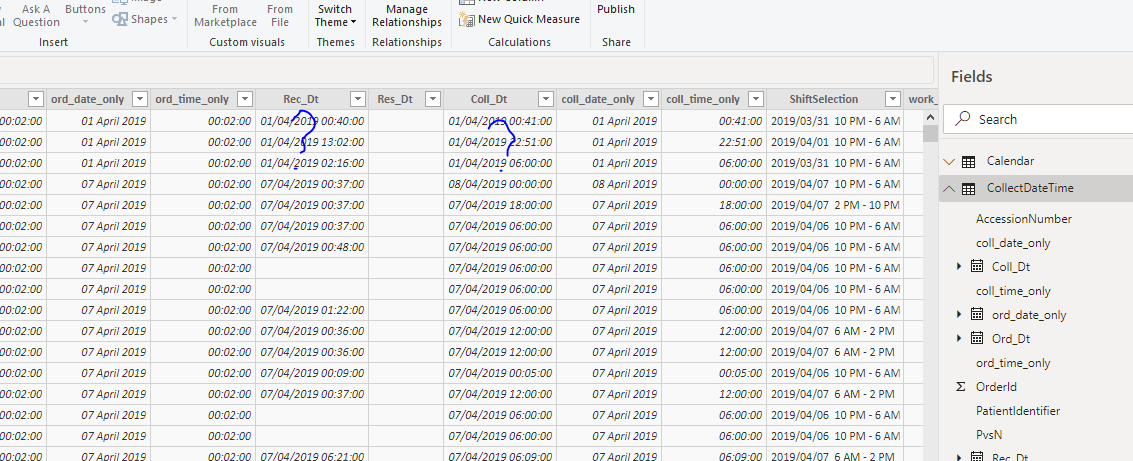
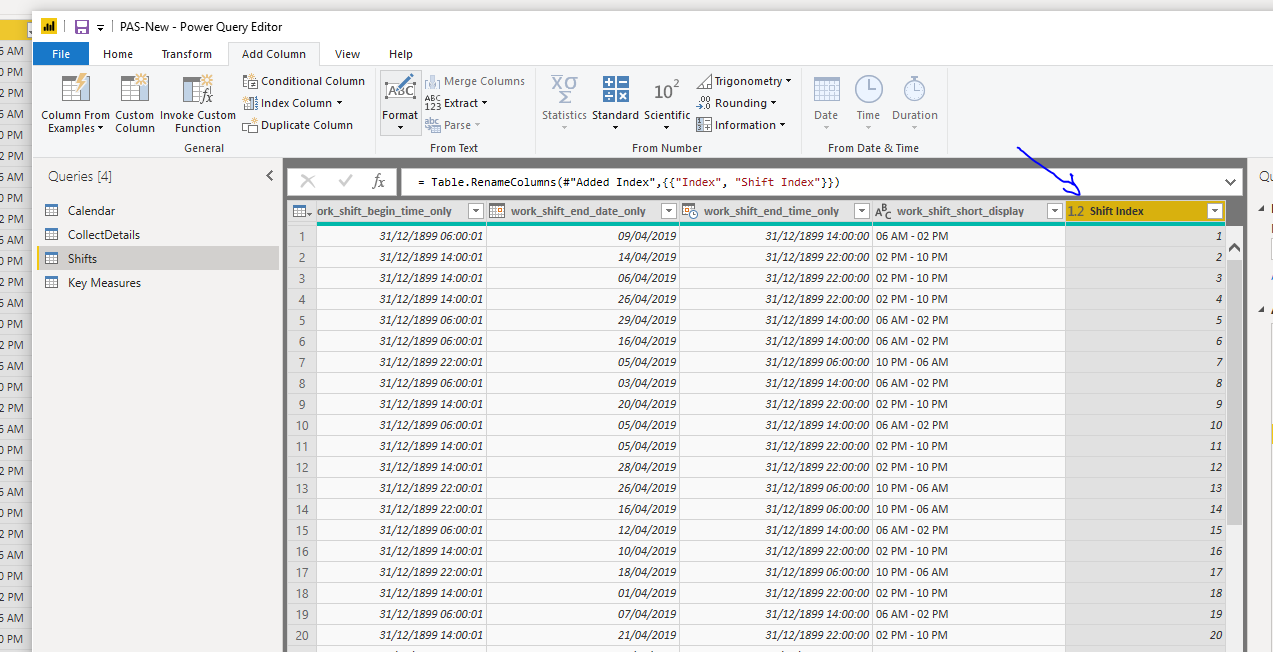
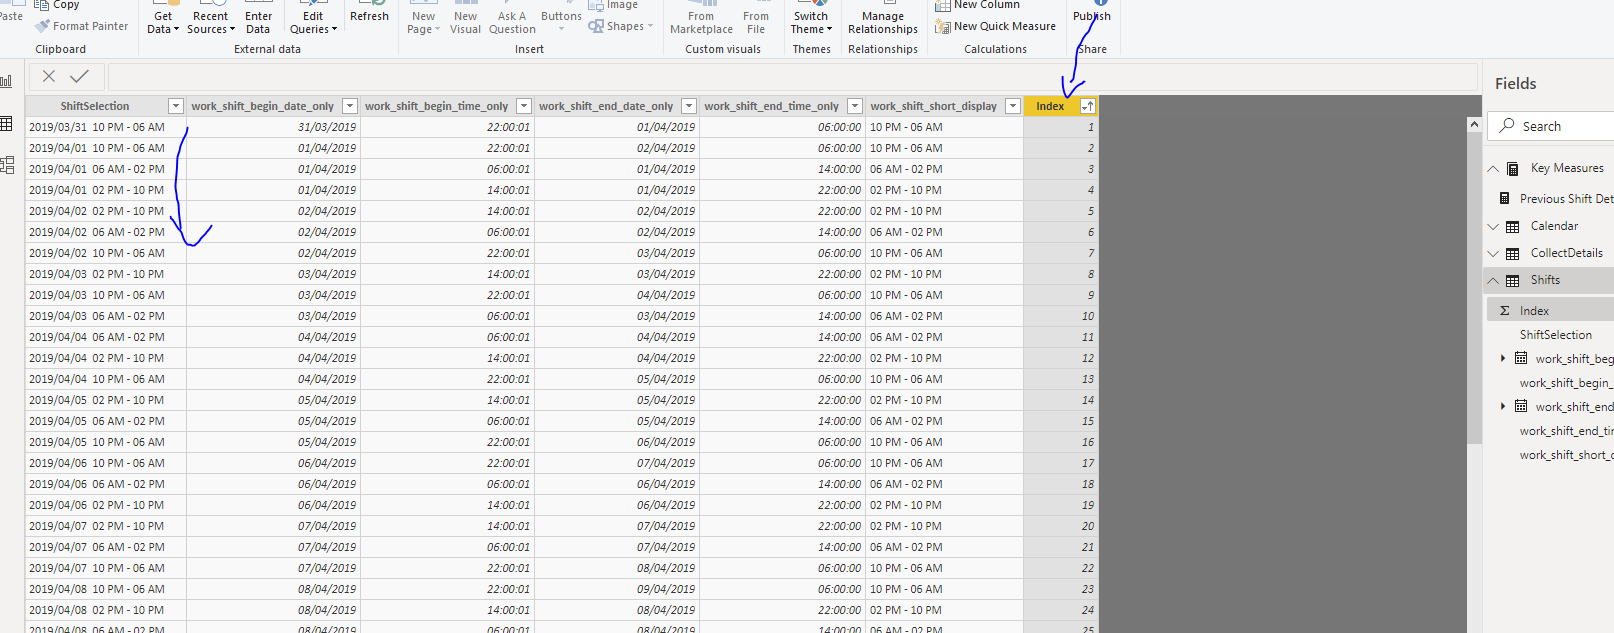
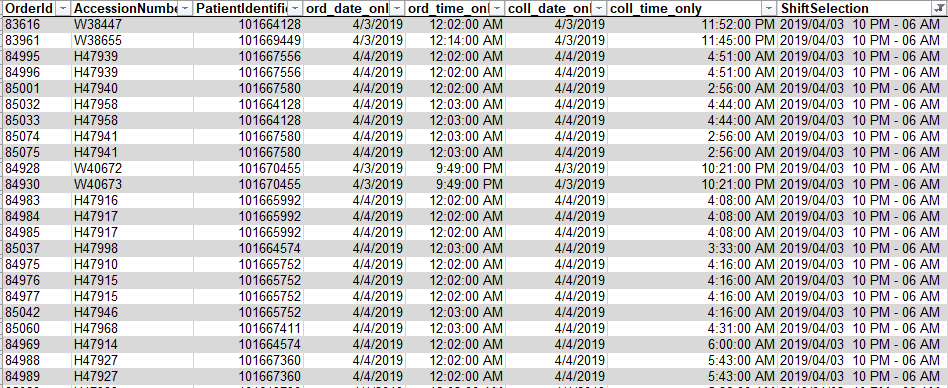
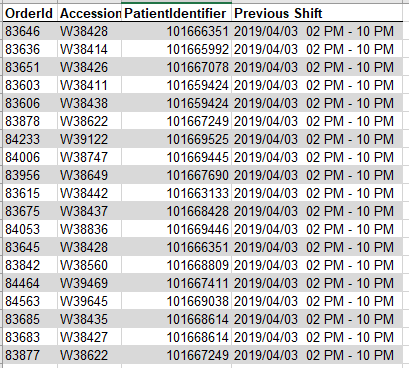
To me, no columns in here have changed at all. It’s still all time and date

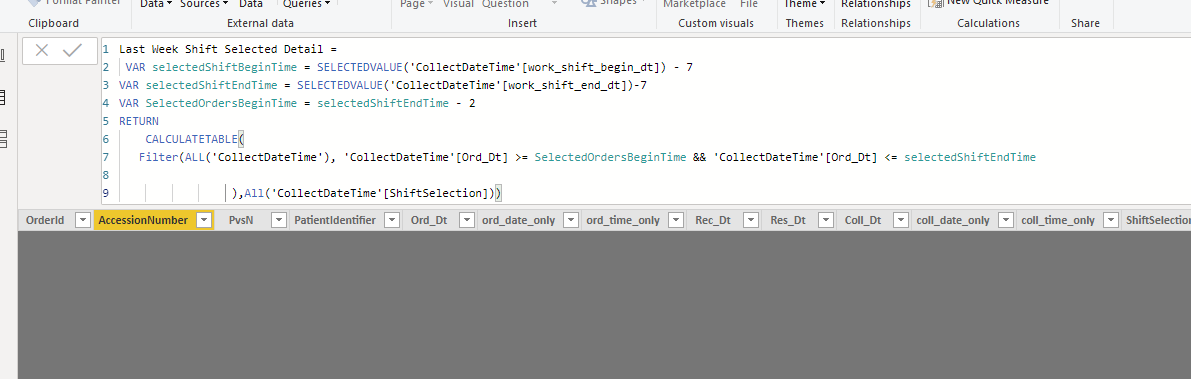
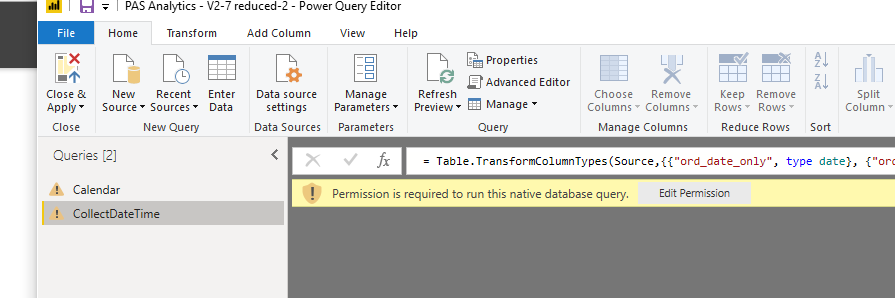
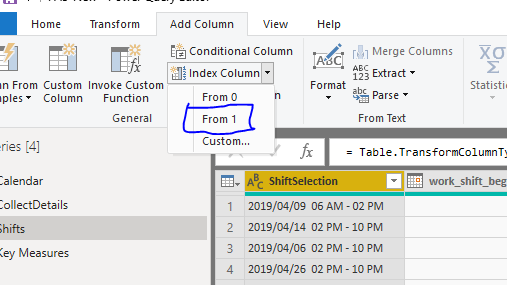
This is the table you should be doing all the work to, and doing it in the query editor.

I can’t do anything myself there unfortunately.


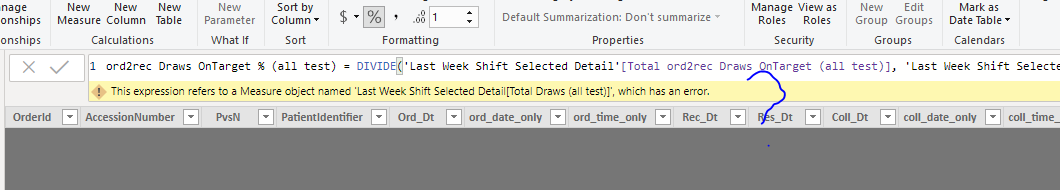
Overall I’m just a bit confused and some of these formulas error out, so I really don’t even know what I’m looking at.

You shouldn’t be doing anything like this anyway in a fact table. All of these calculations (if they are needed at all) should be done in DAX measures.

There’s just a whole lot of simplification that needs to be done here. It is my opinion that this has been made way more complicated than it needs to be and I’m a bit lost on it myself because of this.

As a next step can you sort out the actual fact table as advised and then we can go from there.


For an example of how to calculate time intelligence on weeks, see below

Thanks
Sam

Good morning, Sorry for my sloppy work. I encountered file size limit during pbix upload… hence deleted some data columns in a hurry without close examination. Thank you for your patience.

I re-created the pbix file with clean data tables also providing excel data file here. You were right on the data model. it was ‘bandaged’.

So, I re-designed the data model a bit to show the different filtering needs. In this case, it’s a ‘Shift Dashboard’. Hence I only have filter as shift only to keep our conversation simple. (I have another page that I need to filter based on Dates-- simple – hopefully! lol)

Thanks for the video, it’s really close to what I need. However, on all the training videos that I had watched with time intelligence functions are dealing with amount computes (SUM of sales etc) . I am having a hard time to figure out just to select data as-is to display in my scenario. No SUM, no Average, no Max… just to grab the data to display -->

    (1) Current Selected Shift details 
          Vs. 
    (2) Last week Shift details 

This is to examine details data purpose.

Here are the files:
Collect Data.xlsx (2.2 MB) PAS-New.pbix (1.1 MB)

Thanks again for your prompt reply. Very much appreciated.

Ok first thing, this relationship below is doing nothing and should not be there

Could you not do something like this, where you maybe have an index number to show the order of each shift. This way you have a numeric number that you can filter by within formula to create the right context for your calculations.

For example

image

Now I have this in the Shifts table, and it looks to be in the correct order (I would double check this)

We now have the ability to filter by this particular column and it will impact the fact table.

This is the formula I used.

Previous Shift = 
VAR CurrentShiftIndex = SELECTEDVALUE( Shifts[Index], BLANK() )

RETURN
CALCULATE( SELECTEDVALUE( Shifts[ShiftSelection] ),
    FILTER( ALL( Shifts ), Shifts[Index] = CurrentShiftIndex - 1 ) )

So this is what I have for you now as I’m not quite sure what else you are looking for, but hopefully this gives you the ideas you need to get this to work for you.

Attached.
PAS-New.pbix (1.1 MB)

Thanks
Sam

Thanks this is great. Thanks for the great suggestion on Shift Index. it makes the computation a lot simpler.

With the previous shift column, I also need additional 2 columns of previous shift - AccessionNumber & PatientIdentifier (I may add a few columns… currently only these 3 (previous shift selection, AccessionNumber, PatientIdentifier for now). None of these columns of previous shift to do any SUM(), Average.

I tried a new measure to get AccessionNumber, however, still no success… see below formula
Assuming that I need to select a column at a time with a measure ? is my assumption correct?

PAS-New- AccessNumber attempt.pbix (1.1 MB)

Previous Shift Accession Numbers = 
VAR CurrentShiftIndex = SELECTEDVALUE( Shifts[Index], BLANK() )
RETURN
  SELECTCOLUMNS(
            FILTER( ALL( CollectDetails ), CollectDetails[ShiftSelection] 
                = CALCULATE( SELECTEDVALUE( Shifts[ShiftSelection] ),
                FILTER( ALL( Shifts ), Shifts[Index] = CurrentShiftIndex - 1 ) )
                    )
        , "AccessionNumber", CollectDetails[AccessionNumber] )

I’m really not sure of the data here or what relationship the accession numbers have with each other.

Based on the context of this table how are you planning on associating one orderid, patientidentifier and accessionnumber to a historic one??

To me I just don’t get the logic here at all.

Finding the previous shift isn’t too difficult, but using this to then find these other things, I’m just not sure how this is possible based on the model you have provided.

I just don’t see the connection.

Maybe a suggestion here is to really have a think about the context of the calculation here. Maybe clear this up before moving on.

What if the logic that need to happen behind the scenes in your tables based on the current context you have here.

Thanks
Sam

Hi, thanks for your input.
I am wondering now if this is even doable in power BI.

From the same Data table = CollectDetails,

Visual Table 1: I want to display all details of selected shift.

Visual Table 2: I want to display all details of previous shift of the selected shift from the same CollectDetails table.

Example:
Shift selected = 2019/04/03 10 PM - 06 AM

Visual Table 1, displays all details (orderId, PatientIdentifier, AccessionNumber, Ord_date_only, Coll_Date_only) for shift from 10 PM - 06 AM.

Visual Table 2, displays all details of previous shift = 02 PM - 10 PM (OrderId, PatientIdentifier, AccessionNumber)
image

Maybe in this case, I need to have 2 data tables in power BI with repeating data?

Does this make sense ?

Ok now I understand.

Anything is possible with Power BI, you just need to be really clear on what you need and then using a combination of the model and DAX you can generally find a way.

This needs to be solve mainly in the model actually.

Check out what I have done here

image

Created an inactive relationship

Then I solve it with DAX measures

Selected Shift = 
CALCULATE( SELECTEDVALUE( CollectDetails[ShiftSelection], BLANK() ),
    USERELATIONSHIP( Shifts[ShiftSelection], CollectDetails[ShiftSelection] ) )

Previous Shift = 
VAR CurrentShiftIndex = SELECTEDVALUE( Shifts[Index], BLANK() )

RETURN
CALCULATE( SELECTEDVALUE( Shifts[ShiftSelection] ),
    FILTER( ALL( Shifts ), Shifts[Index] = CurrentShiftIndex - 1 ) )


Prior Shift = 
IF( SELECTEDVALUE( CollectDetails[ShiftSelection] ) = [Previous Shift], [Previous Shift], BLANK() )

So from where you began hopefully, you can see how simple this actually is, once you just set things correctly up in the model.

Attached.
PAS-New- AccessNumber attempt (1).pbix (1.1 MB)

Thanks
Sam

Thanks a lot, This is very nice! A clean model is the key. Appreciate your teaching & guidance on this. :+1: