Dear Fellow Power BI Users -
How can we get the Time e.g.: No Of Days frequency Purchased for a particular product? , example: Product X usually purchased(soled) every 2.5 Days.
Thank You
Dear Fellow Power BI Users -
How can we get the Time e.g.: No Of Days frequency Purchased for a particular product? , example: Product X usually purchased(soled) every 2.5 Days.
Thank You
Review the techniques reviewed in the below
Sam, I’m not sure that this approach would give the right answer. However, I admittedly don’t know how to get what I think is the correct one using DAX…
I have an example I’ve prepared in excel that shows what I think the right approach is and why I don’t think this approach is best. Would it be possible to add a calculated column like I’ve done in the example to give more accurate results? Does this make sense? Is there anything I can do to bring clarity to this?
I’m a little confused as to what we are referring to here.
A lot depends on the context of the calculation.
Also there’s theoretically many ways you can predict something. I don’t think there’s ever one perfect way. It’s just a prediction at the end of the day.
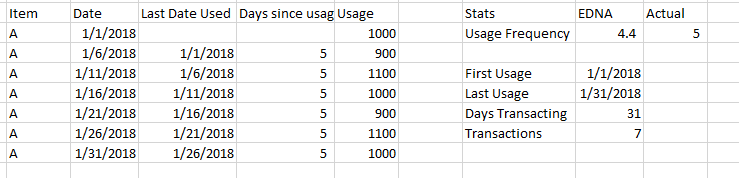
The example here was keeping it pretty simple. Last purchase date minus first purchase date divided by how many days there was actual transactions.
You certainly could get a lot more complicated if you wanted to with this but in this case I wanted to keep it relatively simple.
From what I can gather you averaging the days since last used or purchased. If so, I agree that’s not a bad idea and could also be a good way to calculate this.
I note this idea down and think about working through something like this in the future.
Hi Wesleyfletcher , could share with us your solution just to get an Idea about it?
Let me first apologize for being unclear. I was in a hurry. I should have withheld my post until I could be more clear. This won’t happen again.
My point is this, by using the average in this way, you would show your average usage as being every 4.3 days. However, you’re actually using item A every 5 days. I know this is just a forecast and by it’s very nature it’ll be inaccurate, but I think we can get it a little closer with a small modification.
I spent quite a bit of time thinking about this last night. My quick workaround is this: (last date - first date, or 30 days)/(count of transactions - 1, because you’re measuring the frequency of usage and not the count of usage). This would return a result of 5, which is the correct usage frequency.
My original approach accounted for this, but it was needlessly complicated. However, where this approach could truly yield better results is if you were calculating the median usage frequency. The screen shot below shows usage skewed towards the end of the month in example B. This would lead me to believe that we trialed a product, secured an order, and now we’re consistently producing it.
Assuming this scenario, using the average is less accurate than using the median, which in this case is 1.
The reason why I’m trying to figure this out is that I’m using power bi to help set MRP rules. So, if my demand frequency is wrong, I could theoretically stock out of materials because I had demand that I wasn’t anticipating.
Does this help bring clarity to my post?
All of the above being said, I have no idea how to accomplish this in BI. I think I need a calculated column, but I’m not sure that’s the best way.
Yep I understand it now and quite like it (I would say this is probably a better reflection also). I’ve already noted it down for a future video
I think you could achieve this just with measures.
This is the setup here
First need a formula for last date purchased
Last Purchase Date =
CALCULATE( MAX( Sales[Purchase Date] ),
      FILTER( ALL( Sales[Purchase Date] ), Sales[Purchase Date] < MAX( Sales[Purchase Date] ) ) )
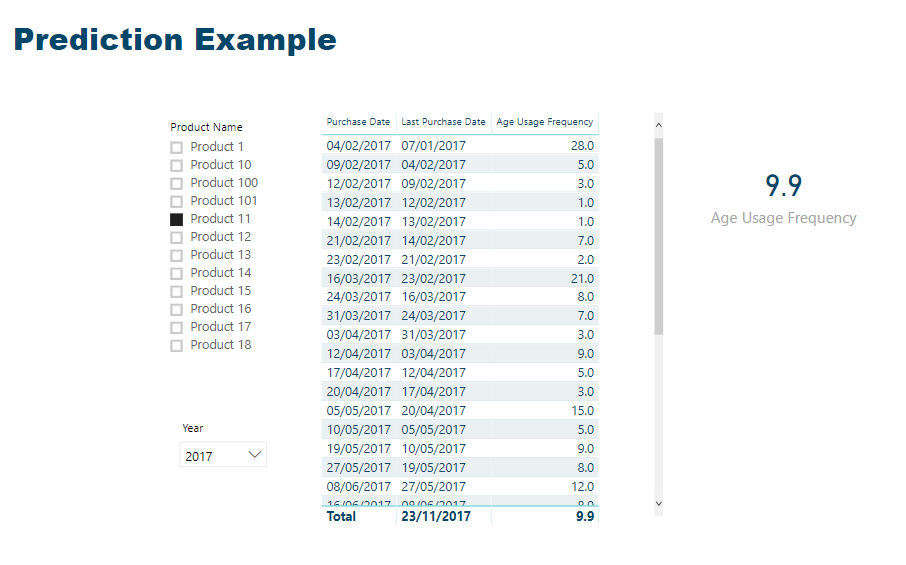
Then this formula works out the difference and also the total average across all purchases (and it’s dynamic, so for any change in product it will recalculate correctly)
Age Usage Frequency =
VAR PurchaseDifference = IF( NOT( ISFILTERED( Sales[Purchase Date] ) ), BLANK(),
                            IF( ISBLANK( [Last Purchase Date] ), BLANK(),
                                VALUE( SELECTEDVALUE( Sales[Purchase Date] ) ) - VALUE( [Last Purchase Date] ) ) )

RETURN
AVERAGEX(
    VALUES( Sales[Purchase Date] ),
        [Day Difference] )
Here’s the mock up in a file
Prediction Example.pbix (468.8 KB)
Sam,
Let me first say that this is a brilliant solution. I’m still not sure I understand it, but I’m going to work at it until I do.
That being said, I can’t get this to render in a full report because my data set is quite large. If I filter on a specific product, it’ll work fine. However, I really need this solution to help me set the timing for reordering - it will help improve cash conversion cycle by not bringing raw materials in before they’re needed.
Can you think of a way to make this solution less taxing on BI? If not, that’s OK because you provided a tremendous solution very quickly!
How big is your dataset here.
The example one isn’t to small and I find the speed is pretty good. I’m presuming it’s very large?
I may have missed some of the formula in the previous post.
Here’s the three main ones to use
This first one is probably the slowest of the lot I would say
Last Purchase Date =
CALCULATE( MAX( Sales[Purchase Date] ),
      FILTER( ALL( Sales[Purchase Date] ), Sales[Purchase Date] < MAX( Sales[Purchase Date] ) ) )


Day Difference =
IF( ISFILTERED( Sales[Purchase Date] ),
    IF( ISBLANK( [Last Purchase Date] ), BLANK(),
         VALUE( SELECTEDVALUE( Sales[Purchase Date] ) ) - VALUE( [Last Purchase Date] ) ),
              BLANK() )


Age Usage Frequency =
AVERAGEX(
    VALUES( Sales[Purchase Date] ),
        [Day Difference] )
Currently I’m not too sure how to speed this up.
How slow is it really?
My dataset is 182,752 KB and It’s so slow it won’t render the report unless I filter to one (1) item.
I have stripped the model of any tables that aren’t absolutely necessary, but it’s still not enough - the model was 312,367 KB.
I dove into the bi file you posted to find the day difference formula  .
.
You’ve given a great solution that will work for the majority of people. The issue is that I’m trying to use BI to replace/supplement a MRP solution.
That’s outrageously large. I don’t think there will really be many DAX solutions that will be much faster when dealing with that size.
How many rows in the fact table?
I’m just not sure that a model that size is really sustainable within Power BI. Is there ways to push some of the logic back to the source (sql for example) or reduce the size of the table you’re working with, or optimizing you model.
I’ve dealt with a lot of model big and small and even the larger ones I can get down to under 10K with some optimization strategies.
I would say is highly unlikely you need ever column in you dataset for the reporting that you require. That’s just what I’ve seen from my experience.
There are 1.2M rows in the raw material usage table.
My company is on a data journey. We really need a cube. But, I think we’re a year away from it.
I don’t personally see how we could get our models down to 10k due to the number of SKUs, etc., but there’s a lot I don’t know about data and BI.
Once again, thank you for your help with this solution! It’s brilliant.
That’s a lot of rows but I’ve worked with that many times.
I would say it’s the column numbers which is the issue. How many columns are there in that table?
I go through all my best practices around the query editor and model in this course
Check it out if you haven’t already. You’ll find a lot of optimization ideas within this module.
Thanks Sam! I’ll go through this and learn all I can from it!
Hi wesleyfletcher , What is the EDNA?
Enterprise DNA
Sam,
I had to revisit this topic for another reason and I stumbled across a great solution to this issue. So, I wanted to share the solution, which I’ve done below. Additionally, I wanted to say thanks for pointing me to your Advanced Data Transformations & Modeling course. Because of that I was able to both greatly simplify my model(s) and increase performance.
Here’s the solution:
> Days Since Last Purchase =
> VAR PriorPurchaseDate =
>         CALCULATE(
>             MAX( Sales[Shipment Date] ),
>             FILTER( Sales,
>                 EARLIER( Sales[Customer Code] ) = Sales[Customer Code] &&
>                 EARLIER( Sales[Bulk Code] ) = Sales[Bulk Code] &&
>                 EARLIER( Sales[Shipment Date] ) > Sales[Shipment Date]
>             )
>         )
>
> Return
> DATEDIFF( PriorPurchaseDate, Sales[Shipment Date], DAY )
From this calculated column all I needed to do was write a simple average, or median formula. I can even calculate the std deviation. The applications are endless! Although in this instance I’m trying to determine the pacing of production for stock items.
So, thanks! And, I hope this is helpful!
A note:
Here’s the link to the solution. I wish I could take credit for this, but I cannot. I only combined the solution into one column.
Nice one, really like it. Thanks for sharing
Can you give the resources link of this Video please?
Thank you