It is and it isn’t. It does what it’s expected to do based on the instructions you gave it, yet it doesn’t achieve what you’re expecting because of a potential misunderstanding of how CALCULATE and filtering work within DAX
Your DebtorMovements aims to replicate Excel’s SUMIF by calculating a sum of amounts in the ZTBR table where the Roll_Up_Function column equals “Debtor Movements”, and then adding 4801 to the result.
It calculates a total value (including the constant 4801) without applying row-level context. While CALCULATE indeed changes the context in which data is evaluated, it does so here without a row-level filter or context, resulting in the same total for every row.
The line 'ZTBR’[Roll_Up_Function] IN {“Debtor Movements”} is applying a filter to the calculation, but it’s not introducing a row-level context in the way you might be expecting. Instead, this condition is used to filter the ZTBR table to only include rows where Roll_Up_Function equals “Debtor Movements” before performing the sum operation. This filtering step is applied to the entire calculation globally, not on a per-row basis in the context of other rows or tables.
It’s essential to differentiate between row context, which pertains to calculations done row by row in calculated columns, and filter context, which influences how data is aggregated in measures. The latter is what your current measure is using.
To apply calculations that vary by row, you might consider using an iterator function like SUMX . This function can iterate over a table, applying a calculation to each row based on your specified conditions. For example, if you wanted to sum amounts for each ‘Debtor Movement’ and then add 4801 to each individual sum, SUMX would allow for this level of detail. However, without knowing exactly how your data is structured and what specific outcome you’re aiming for, this is just a conceptual suggestion.
Your description lacks specific details on the desired row-level variance. Can you provide an example showing what you are seeing and what you are expecting to see instead? Just some sample data and the expected results for those data.
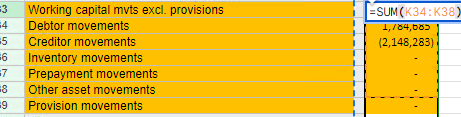
Thank you for replying. I am looking to translate:
The amount shown for Creditor movement is the final after the +(addition) . Originally in an Excel sheet/calculation, i worked it into PowerBI. Do you approve of this:
DebtorMovements=
IF (
    SELECTEDVALUE('ZTBR'[Roll_Up_Function])="Debtor Movements",
    CALCULATE (-SUM ('ZTBR'[Amount in USD]),'ZTBR'[Roll_Up_Function]="Debtor Movements")+4801,
    BLANK()
)