Hello @Anu,
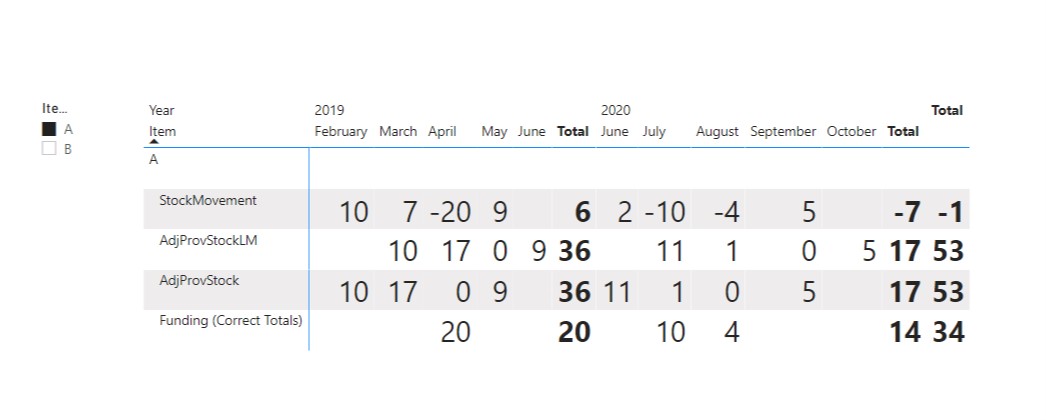
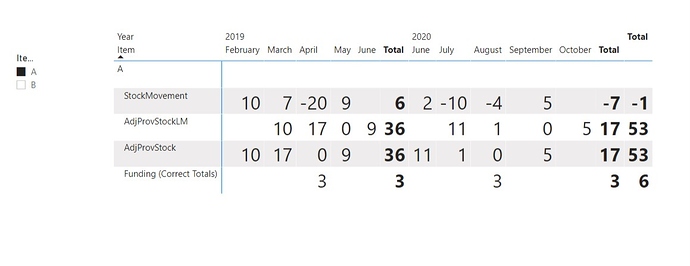
Well, I just wrote 2 simple formula’s firstly to calculate the figures of individual line items and then to calculate the correct totals. Below are the formulas provided for the reference -
Funding - Harsh =
IF (
    ( [AdjProvStockLM] + [Stock Movement] ) < 0,
    ( [AdjProvStockLM] + [Stock Movement] ) * -1 ,
    BLANK() )


Funding (Correct Totals) =
SUMX(
    SUMMARIZE(
        'Date' ,
        'Date'[Date] ,
        "Correct Total" ,
        [Funding - Harsh] ) ,
    [Correct Total]
)
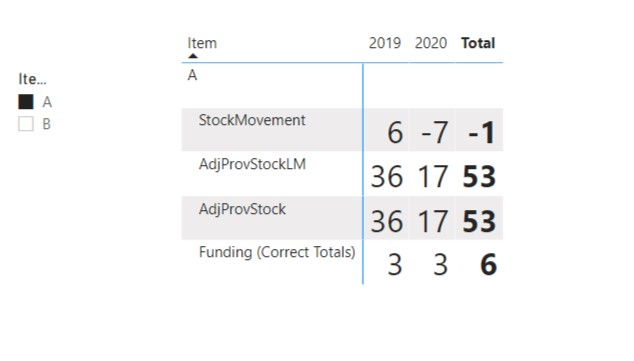
Below is the screenshot provided of the final result. It shows the correct results whether drilled downwards or upwards -
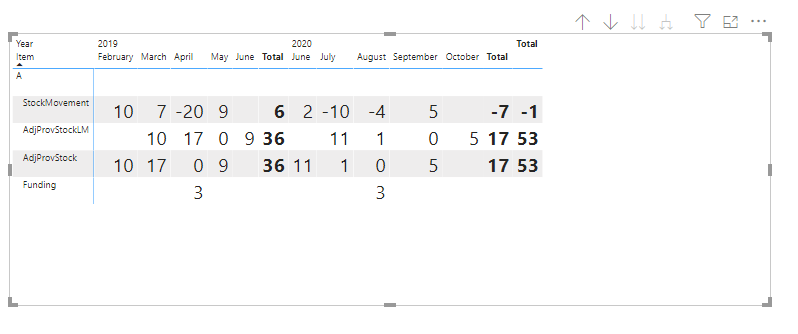
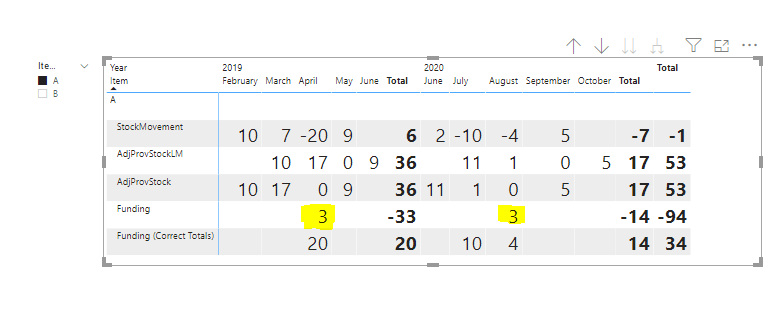
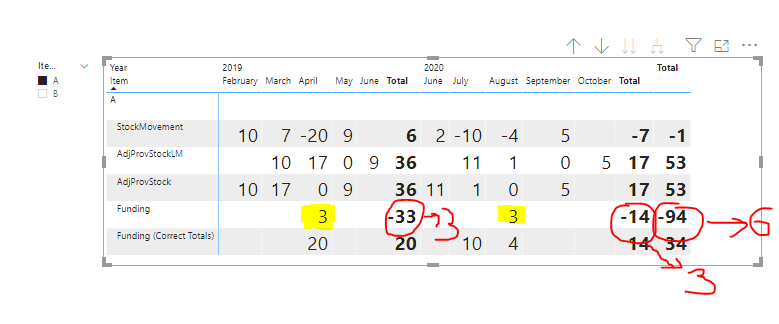
Would like to know your thoughts about why this long formula was written? As given below -
Funding - 1 =
VAR vTable1 =
    ADDCOLUMNS (
        CALCULATETABLE (
            VALUES ( 'Date'[Year] ),
            FILTER ( 'Funding', Funding[AdjProvStock] + Funding[StockMovement] < 0 )
        ),
        "Value",
            ( SUM( Funding[AdjProvStock] ) + SUM ( Funding[StockMovement] ) ) * -1
    )

RETURN
    IF (
        HASONEVALUE ( 'Date'[MonthOfYear] ),
        IF (
            [AdjProvStockLM] + SUM ( Funding[StockMovement] ) < 0,
            ( [AdjProvStockLM] + SUM ( Funding[StockMovement] ) ) * -1
        ),
        SUMX( vTable1 , [Value]
        )
    )
But anyways, I’m attaching the working of my PBIX file for the reference.
Hoping you find this useful and meets your requirements that you’re looking for. 
Note: As shown in the link provided above, I’ve followed the “Measure Branching Technique” to calculate the correct totals. Since I like the calculations happening step-by-step rather than it happening virtually (In terms of “Variable Technique”).
Thanks and Warm Regards,
Harsh
Fund - Harsh v2.pbix (184.6 KB)
