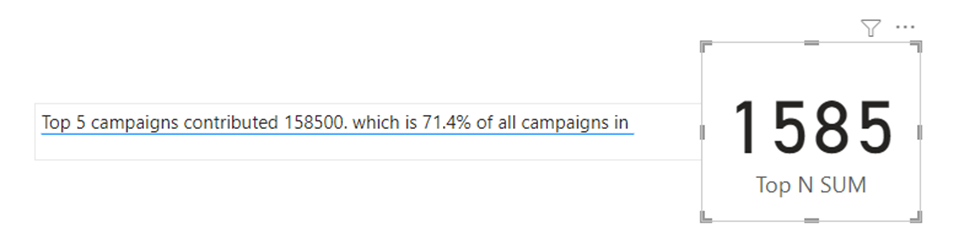
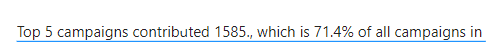
Can someone tell me what is wrong with my syntax? I have a dynamic chart title and format both fixed and percent numbers. The % numbers is working but I can’t for some reason get the fixed number to work. I want a “,” to so seperate the thousands. In the below example, I want to show 1,585.
Thanks for your help.
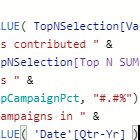
My formula is
"Top " & SELECTEDVALUE(TopNSelection[Value]) & " campaigns contributed " & Format(TopNSelection[Top N SUM], “#.#, which is " & FORMAT(TopCampaignPct,”#.#% of all campaigns in " &SELECTEDVALUE(‘Date’[Qtr-Yr]) ))
Hi @ysherriff. It looks like your trying to include text in your FORMAT commands; when I split your measure onto separate lines ending in the “&”, it looks like this:
Wrong =
    "Top " &
    SELECTEDVALUE(TopNSelection[Value]) &
    " campaigns contributed " &
    Format(TopNSelection[Top N SUM], "#.#, which is " &
        FORMAT(TopCampaignPct,"#.#% of all campaigns in " &
            SELECTEDVALUE('Date'[Qtr-Yr])
        )
    )
I’m guessing you’re trying to achieve something like this:
Perhaps Right =
    "Top " &
    SELECTEDVALUE( TopNSelection[Value] ) &
    " campaigns contributed " &
    FORMAT( TopNSelection[Top N SUM], "#.#") &
    ", which is " &
    FORMAT( TopCampaignPct, "#.#%") &
    " of all campaigns in " &
    SELECTEDVALUE( 'Date'[Qtr-Yr] )
If you’d like to pursue further, please attach a work-in-progress PBIX file with a marked-up screenshot of the visual in question and what is your desired outcome.
Thanks Greg. Please see the attached file. Also, is there a way on the Color measure under TopNSelection table that I can format each bar of the column bar a different color. Keep “Others” grey but the other bars varying color.
Hi @ysherriff. Just adjust the first FORMAT string as desired, like:
Campaign Title 2 =
VAR TopCampaign =
    CALCULATE(
        [Total Campaigns],
        TOPN(
            SELECTEDVALUE( TopNSelection[Value] ),
            ALLSELECTED( 'Campaign Table'[Campaign Name] ),
            [Total Campaigns]
        )
    )
VAR TopCampaignPct =
    DIVIDE( TopCampaign, [Total Campaigns] )

RETURN
"Top " &
SELECTEDVALUE( TopNSelection[Value] ) &
" campaigns contributed " &
FORMAT( TopNSelection[Top N SUM], "#,#.#" ) &
" , which is " &
FORMAT( TopCampaignPct, "#.#%" ) &
" of ALL campaigns IN " &
SELECTEDVALUE( 'Date'[Qtr-Yr] )
I’ve attached my sandbox PBIX in case it helps.
As for the bar colour, I think you have the conditional formatting setup correctly, however in the few minutes I had available to look, I couldn’t get the “Others” line/bar to show in the visual, so couldn’t check further.