Hello,
I’m currently working on creating a budget report in powerbi. I’ve got the data model setup but I’m having a little problem formating the report according to the client’s request.
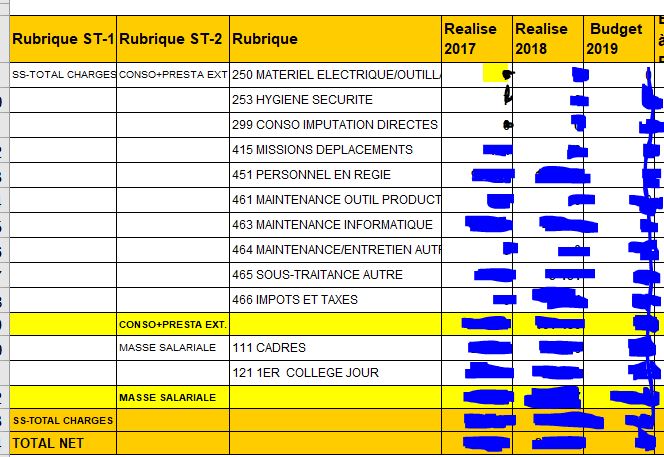
With the default matrix graph, are we able to create a report as in screenshot attached? Maybe a link to an existing Enterprise DNA video might help? I’ve watched the financial reporting video, but the format used was already predefined in Excel (ie with indentation for each group/category) and imported into PowerBI.
In the screenshot, the dimension is ExpenseType with the following fields :
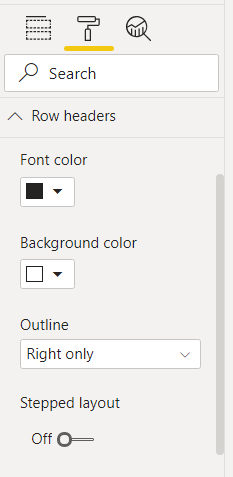
I’ve been following the Financial Reporting with power BI and cannot find the Stepped Layout, i’ve heard microsoft took it out, can you help me building that visulization or point me the right direction?