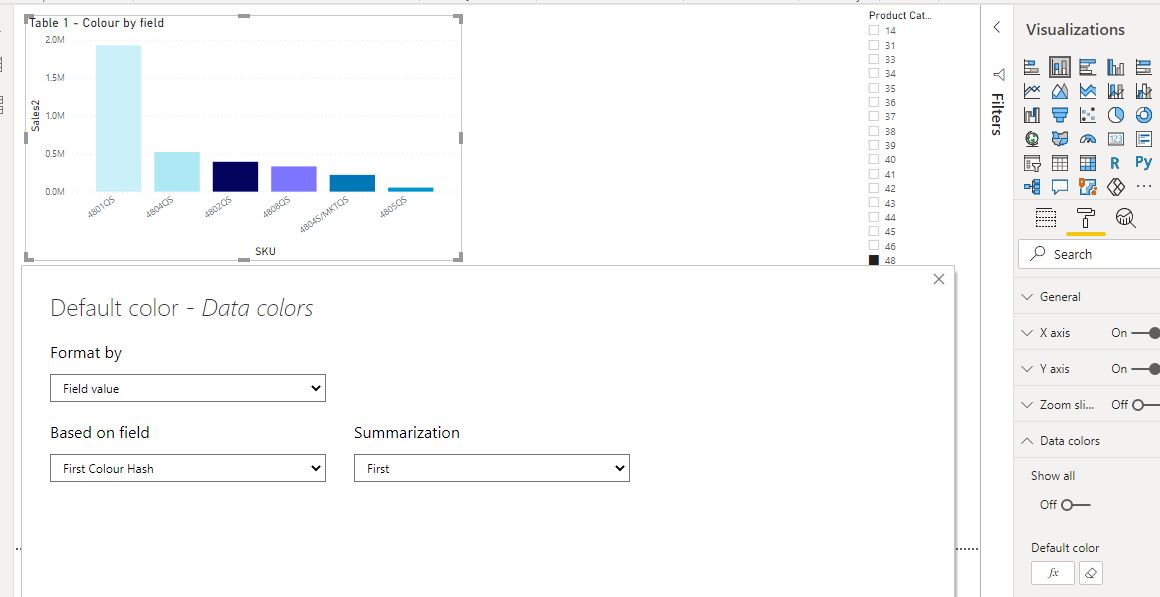
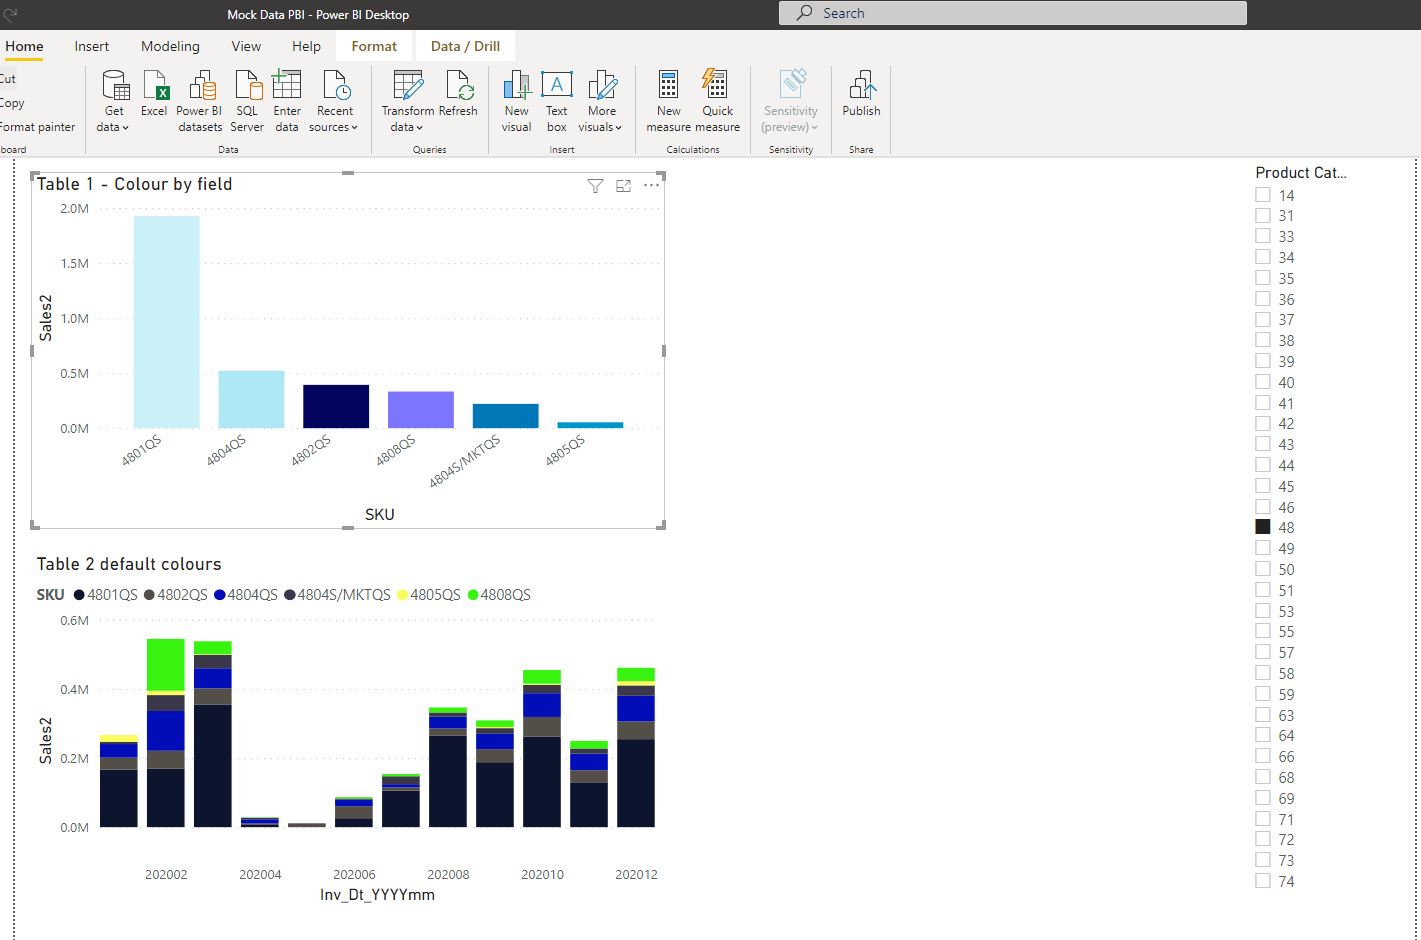
With table 2 I can only go and select each colour manually. This is annoying because as you can see on the right there are lots of product categories but if I want the charts to display good looking colours I have to manually select hundreds of different colours for products, which is something I won’t be doing
Is there a different way of doing this? I don’t want to have to select each colour manually.
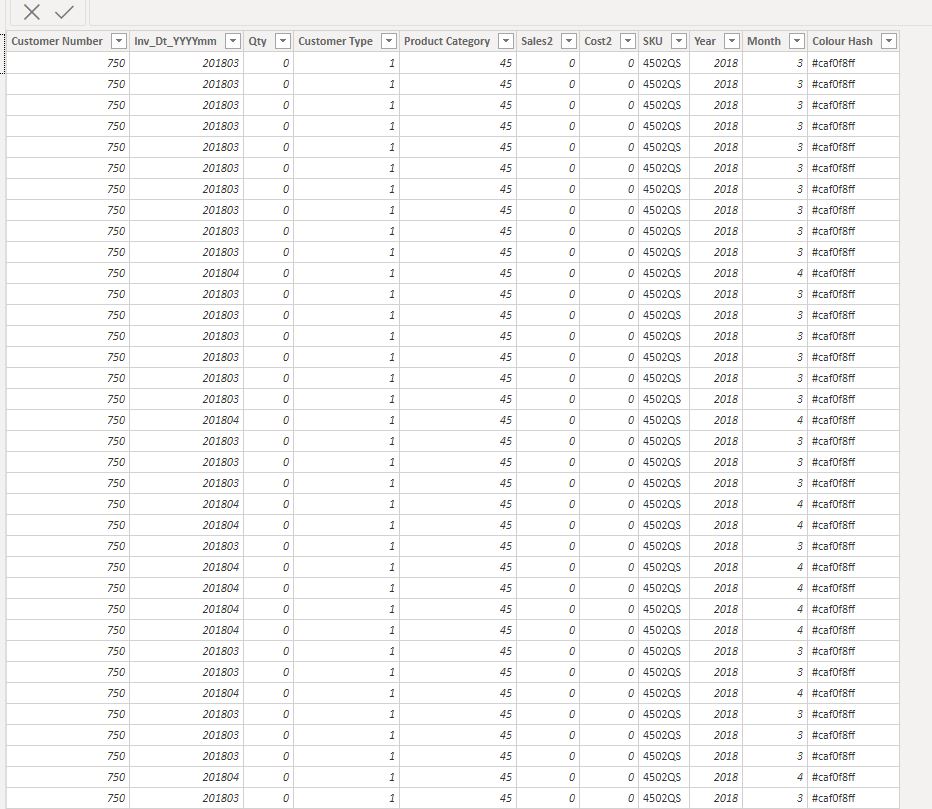
As you can see, my table contains all of the colour hashes I need for the charts
I don’t believe there is an easy way to achieve what you are asking for - the only solution I could come up with was to conditionally format the data based on a column in the dataset (basically to add an HTML code to each product). Unfortunately, in my testing, that didn’t work - because the only way to conditionally format the data is to have the format on the measure - and the measure doesn’t actually cause the columns to stack.
I think you are left with few choices (and none of them great)
accept the color issues
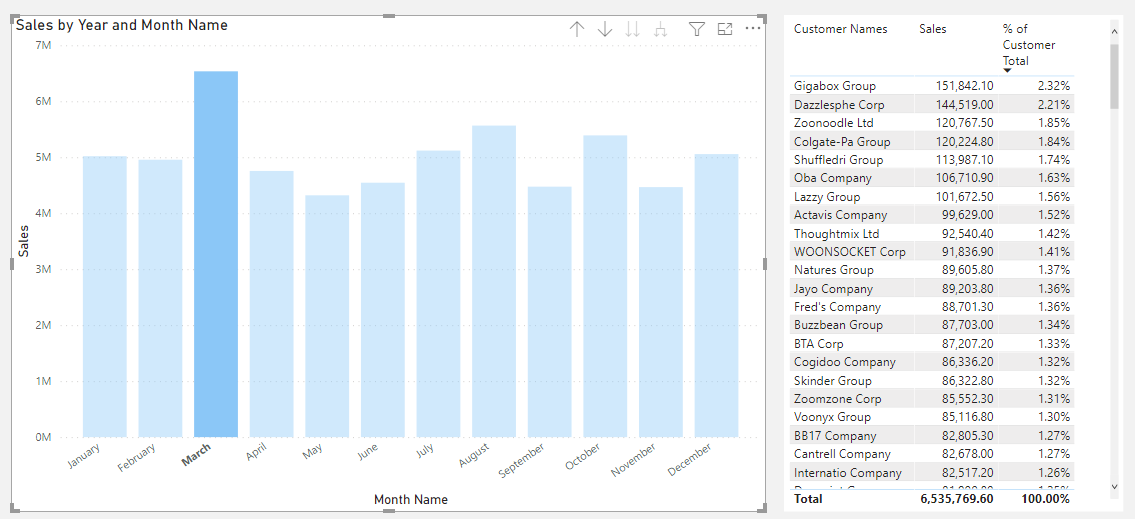
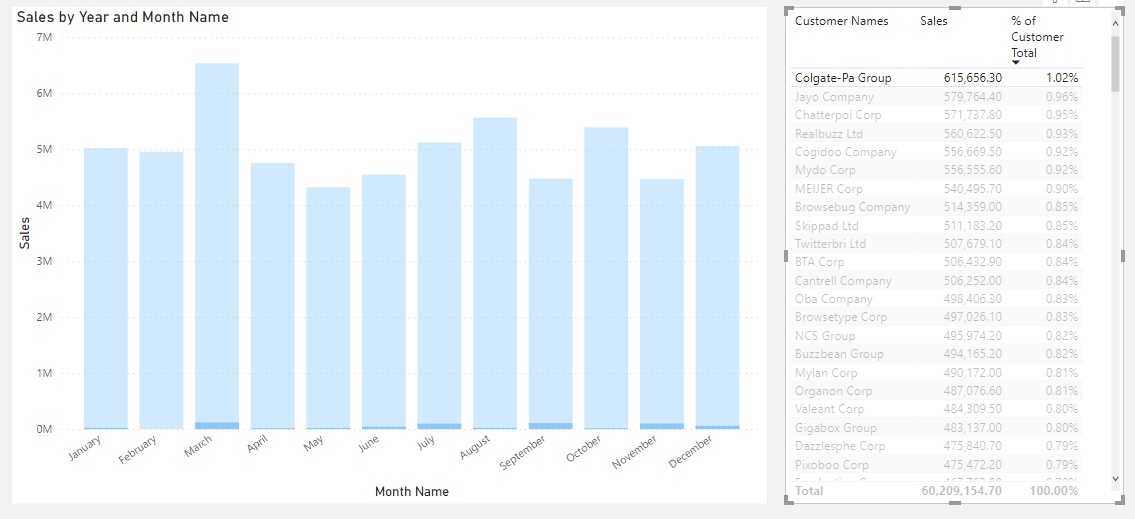
abandon the idea of a stacked column chart to demonstrate this data, and switch instead to a table that will allow you to sort as needed, and include percentage of total, or percentage of month in a column.
manually change the color on every item (this is the one I dislike the most, as it will require a LOT of fiddling with your table as data is added)
Personally, I would choose option 2, which would allow anyone using the report to cross filter to see how particular products and months interacted. See attached (which I prepared for answering your earlier question so it’s not using your dataset)
Wow, really?
This is the first time since using PowerBI that I’ve really felt disappointed.
Bi is meant to be about building charts with good looking colours, I’m surprised Microsoft didn’t think of this.
The only option is option 3 unfortunately as planning in my company uses stacked column charts to compare product sales within a brand over x number of years. The marketing teams currently make the stacked column charts in excel one brand at a time. I was hoping to pleasantly surprise the marketing director with this PBI solution but looks like it’s not to be. We are now left with a choice between manual pbi and manual excel horray microsoft!
I thought you might be able to download the colors and populate the colors with your sku and put into a table as one of the video showed and link them to a conditions as @Heather tried.
As i stated in your other posting you might want to send a message directly to Microsoft Powrer Bi Support team or post it into Power Bi Community.
Hi @Timmay, did the response provided by the users and experts help you solve your query? If not, how far did you get and what kind of help you need further? If yes, kindly mark as solution the answer that solved your query. Thanks!
Hi @Timmay, we’ve noticed that no response has been received from you since the 16th of March. We just want to check if you still need further help with this post? In case there won’t be any activity on it in the next few days, we’ll be tagging this post as Solved.
Hi @Timmay, a response on this post has been tagged as “Solution”. If you have a follow question or concern related to this topic, please remove the Solution tag first by clicking the three dots beside Reply and then untick the check box.
We’ve recently launched the Enterprise DNA Forum User Experience Survey, please feel free to answer it and give your insights on how we can further improve the Support forum. Thanks!