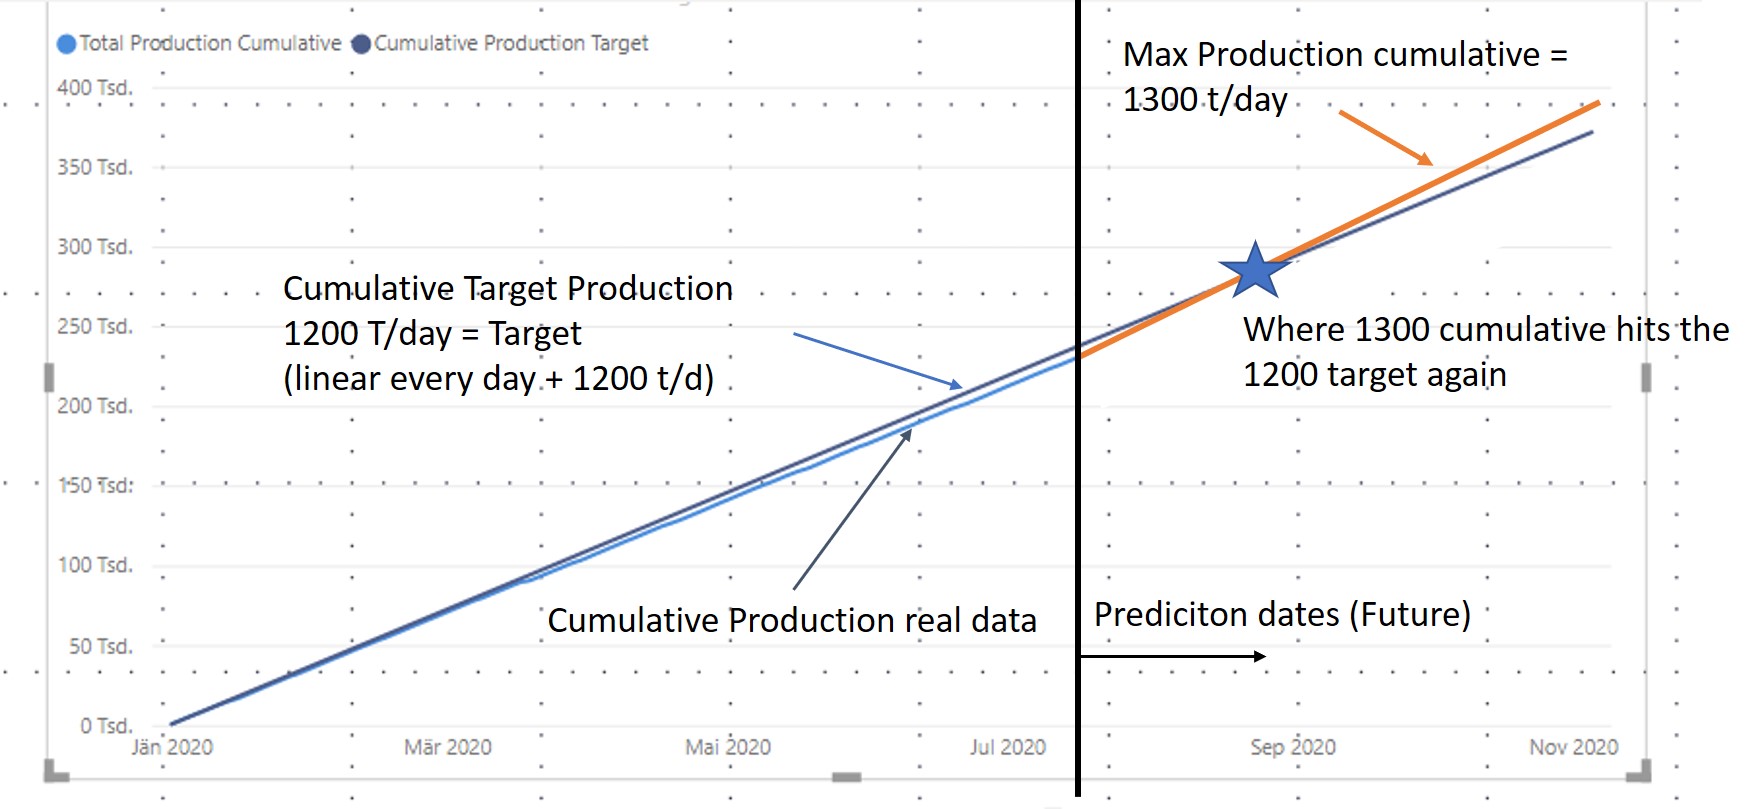
In the following picture you can see cumulative production dates, where the real production values are smaller than the target production which is defined by 1200 tons/day.
The black vertical line shows the actual day.
From this moment on (prediction until end of year) I want to predict a new line (organe) which is the possible maximum production of 1300 tons/day (should start at the last real cummulative production data and then in future every day +1300 tons/day).
So I want to know the point where the 1300 tons/day line hits the original 1200 tons/day target production line again an how many days are needed to hit again.
The 1300 (max production line) should start at the last real cumulative production data( starting point ~ 220.000 tons cumulative).
I have tried the whole day but I really have no idea how to implement this in my model.
Please share a mock-up of your model in a PBIX file and the work you have already done. Also include how you want to visualize results and what the expected outcome should be.
Hi @Lukas, we aim to consistently improve the topics being posted on the forum to help you in getting a strong solution faster. While waiting for a response, here are some tips so you can get the most out of the forum and other Enterprise DNA resources.
Use the forum search to discover if your query has been asked before by another member.
When posting a topic with formula make sure that it is correctly formatted to preformatted text </>.
Use the proper category that best describes your topic
Provide as much context to a question as possible.
Include the masked demo pbix file, images of the entire scenario you are dealing with, screenshot of the data model, details of how you want to visualize a result, and any other supporting links and details.
enclosed you will find the key Dax formular which I have designed to work on the forecasting.
Cumulative Target = Normal table each number 1200 t/day
Cumulative Production Target = CALCULATE( [Target Production by Month],
FILTER( ALLSELECTED( Datum ),
Datum[Datum] <= MAX( Datum[Datum] ) ) )
Target Production by Month = [SUM Target Production]*[Days in Date Context]
Total Production Cumulative:
Total Production Cumulative = CALCULATE( [Total Production by Month],
FILTER( ALLSELECTED( Datum ),
Datum[Datum] <= MAX( Datum[Datum] ) ) )
Total Production by Month = [Average Production Bleach Plant, t/h]*[Days in Date Context]*24
Days in Date Context = COUNTROWS(FILTER(Datum,NOT(ISBLANK(Datum[Datum]))))
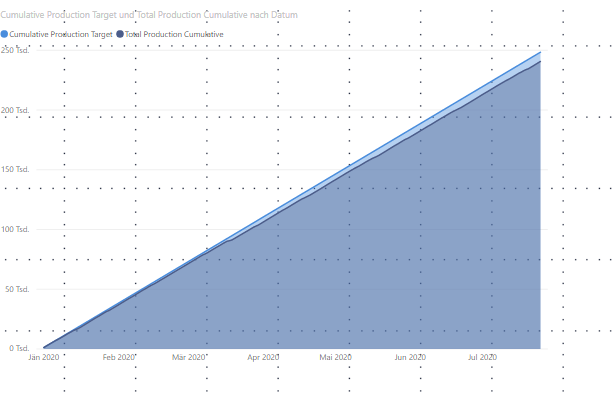
This is the basic chart where I will implement the forecast model.
So, for example. On 25th July (this should be here the actual/last date), the difference between target production and the real production is around -8000 tons in total sum.
I want to make a forecast from this point on with a total production which is now 1300 t/day (linear every day 1300 t/day). Then we should see on the chart that at a certain point in future, the 1300 t/day line should hit the 1200 target line again.
This is the most important information in this model. So how many days the production has to run on maximum capacitiy to reach the yearly target of 1200 t/day again.
It should also (if possible) calculate the amount of days until we hit the 1200 target again.
See if you can strip your model down, a mock up is all that is needed / share via GDrive or whatever. A sample would really go a long way here. Thanks again.
.
There was a bi directional filter between your Date Dimension and Fact table - changed that into oneway
Not all Dates were present for the current year. Note that full years need to be present in your date table for Time Intelligence functions to work and to be able to project data into the future - changed the source step from the date table query into: #“Dates Query”( #date(2016, 1, 1), Date.EndOfYear( DateTime.FixedLocalNow()), 4)
Kudo’s for marking your Date table as a Date table.
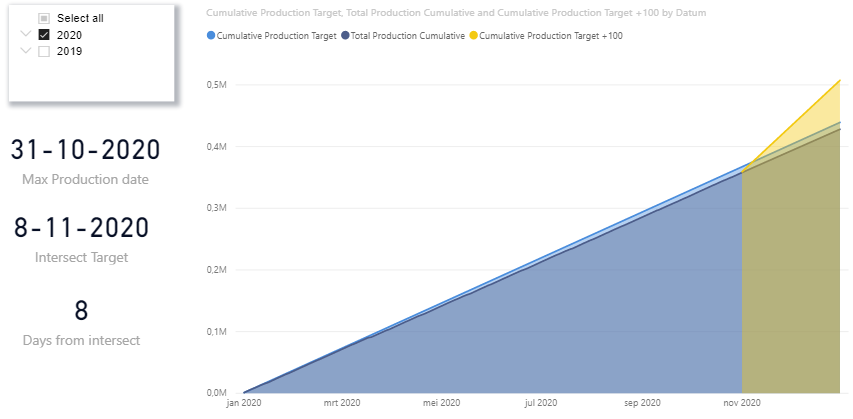
Next created the following measures:
Max Production date =
MAXX( ALL(Prozessdaten[Produktionstag]), Prozessdaten[Produktionstag] )
.
Cumulative Production Target +100 v2 =
VAR LastProduction = MAXX( ALL( Prozessdaten[Produktionstag] ), Prozessdaten[Produktionstag] )
RETURN

SWITCH( TRUE(),
    MAX( Datum[Datum] ) > LastProduction,
    CALCULATE( [Total Production by Month],
        FILTER( ALLSELECTED( Datum ),
            Datum[Datum] <= LastProduction
        )
    ) +
    CALCULATE( [Target Production by Month 100],
        FILTER( ALLSELECTED( Datum ),
            Datum[Datum] > LastProduction &&
            Datum[Datum] <= MAX( Datum[Datum] )
        )
    )
)
.
Intersect Target =
VAR TimeTable = VALUES( Datum[Datum] )
VAR Intersection = FILTER( ADDCOLUMNS( TimeTable, "@Test", [Cumulative Production Target] <= [Cumulative Production Target +100] ), [@Test] = TRUE() )
VAR Result = MINX( Intersection, [Datum] )
RETURN

Result
.
Days from intersect =
VAR TodaysDate = [Max Production date] // TODAY()
VAR Intercept = [Intersect Target]
VAR Result = INT( Intercept - TodaysDate )
RETURN

Result
I don’t follow, please specify your requirement in more detail.
The measure below calculates the forecast from the moment of LastProduction onward like requested. Based on your Slicer time period selection that could be for the entire (remainder of the) year.
Cumulative Production Target +100 v2 =
VAR LastProduction = MAXX( ALL( Prozessdaten[Produktionstag] ), Prozessdaten[Produktionstag] )
RETURN

SWITCH( TRUE(),
    MAX( Datum[Datum] ) > LastProduction,
    CALCULATE( [Total Production by Month],
        FILTER( ALLSELECTED( Datum ),
            Datum[Datum] <= LastProduction
        )
    ) +
    CALCULATE( [Target Production by Month 100],
        FILTER( ALLSELECTED( Datum ),
            Datum[Datum] > LastProduction &&
            Datum[Datum] <= MAX( Datum[Datum] )
        )
    )
)
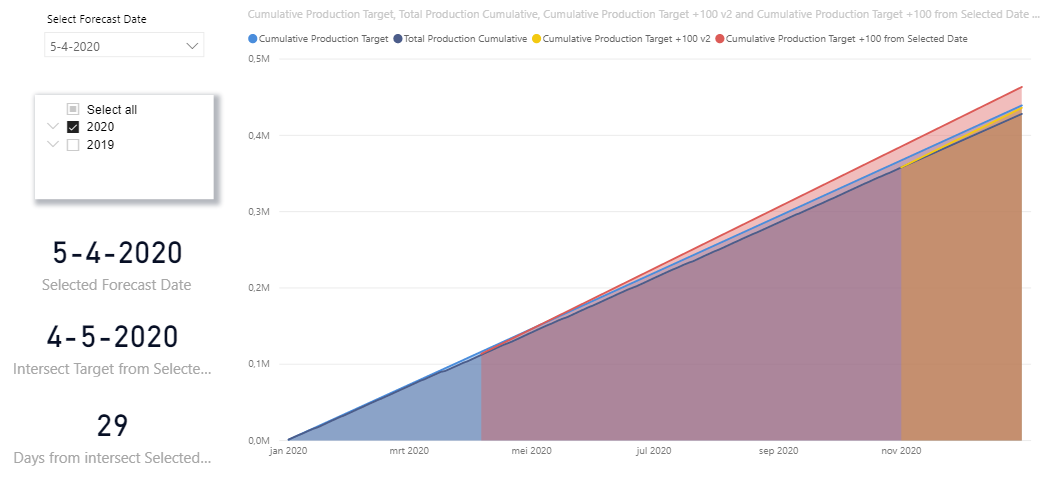
Now it’s based on the last production day or on the last entry of production data from the table Prozessdaten (31.10.2020).
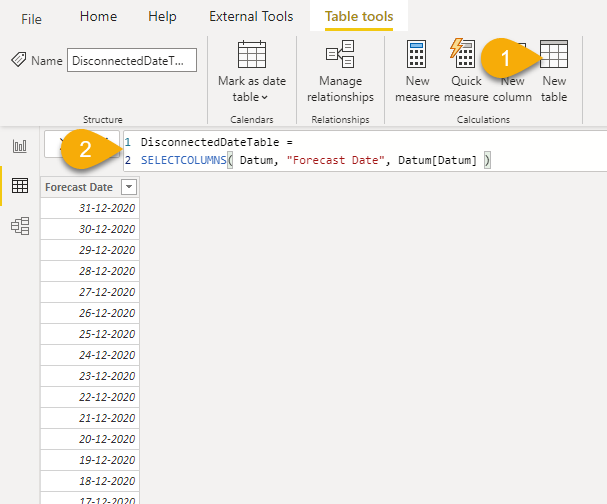
I would like to have the possibility to choose on the slicer a previous date (random date of past) like 05.04.2020 which should be then the starting point of the forecast calculation (target and target 100 could be running until the end of the data set (31.10.2020).
Created a measure to filter the number of visible dates down.
FilterViewDates =
COUNTROWS(
    FILTER( DisconnectedDateTable,
        DisconnectedDateTable[Forecast Date] IN VALUES( Datum[Datum] ) &&
        DisconnectedDateTable[Forecast Date] <= [Max Production date]
    )
)
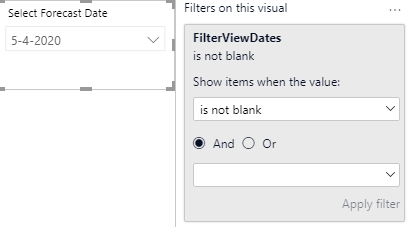
Created a Slicer and placed that filter measure in the “Filters on this visual” section
Recreated all measures.
Cumulative Production Target +100 from Selected Date =
VAR LastDay =  MAXX( ALLSELECTED( Datum[Datum] ), Datum[Datum] )
VAR SelectedDate = MAX( DisconnectedDateTable[Forecast Date] )
VAR NextDates = CALCULATETABLE( VALUES( Datum[Datum] ), Datum[Datum] >= SelectedDate, Datum[Datum] <= LastDay )
RETURN

SWITCH( TRUE(),
    MAX( Datum[Datum] ) > SelectedDate,
    CALCULATE( [Total Production by Month],
        FILTER( ALLSELECTED( Datum ),
            Datum[Datum] <= SelectedDate
        )
    ) +
    CALCULATE( [Target Production by Month 100],
        FILTER( NextDates,
            [Datum] <= MAX( Datum[Datum] )
        )
    )
)
.
Intersect Target from Selected date =
VAR TimeTable = VALUES( Datum[Datum] )
VAR Intersection = FILTER( ADDCOLUMNS( TimeTable, "@Test", [Cumulative Production Target] <= [Cumulative Production Target +100 from Selected Date] ), [@Test] = TRUE() )
VAR Result = MINX( Intersection, [Datum] )
RETURN

Result
.
Days from intersect SelectedDate =
VAR TodaysDate = MAX( DisconnectedDateTable[Forecast Date] )
VAR Intercept = [Intersect Target from Selected date]
VAR Result = INT( Intercept - TodaysDate )
RETURN

IF( NOT( ISBLANK( Intercept )), Result )