Hi @sam.mckay
I’ve been working through the budgeting and forecasting mini series and including what I’ve learned in my work reports.
These additions to my reports have been met with enthusiasm by my manager.
Unfortunately my boss now wants more. With one of the reports, actual sales is above budget for the financial year and is likely to remain above budget. He wants me to forecast where we’ll end up at the end of the financial year if we keep tracking as we are.
Are there any modules that cover such a scenario? I guess he wants a budget line, actual sales and a forecast line projecting to the end of the financial year.
Thanks.
Can this be a simple as creating a measure
Measure =
SWITCH(TRUE(),
Actual > Budget, Actual, Budget)
Something like this
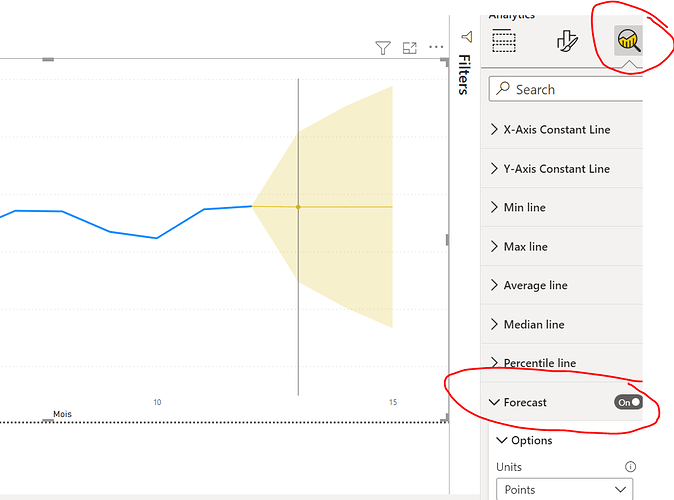
There’s a default forecast in the Line Chart visuals, you can activate that and choose the time you want to show (2 months, 30 days…) This will give you a forecast of your sales. The problem here is that you can’t add the budget to the same visual, you will have to show it on another visual. But if you have a clear measure of your forecast (ex 2% increase over the next months) you can then create a measure of the forecast that will be built on the actual sales, you can show them all on one visual.
Hi @KieftyKids , did the response provided by the users and experts help you solve your query?
If not, how far did you get and what kind of help you need further? If yes, kindly mark as solution the answer that solved your query. Thanks!
Hi @KieftyKids, due to inactivity, a response on this post has been tagged as “Solution”. If you have any concern related to this topic, you can create a new thread.
