Hello everyone,
I am hoping to create a simple forecast dashboard/model of Turnover for remainder of 2022. The following are the key requirements and any assistance on how to set this model up along with DAX calculations would be much appreciated (or any useful resources).
Model Requirements
-
Must update to show actuals and forecast on same visual – as actuals are updated on a monthly basis.
-
Turnover is split by 10 Salespeople in total so need to show their individual turnover run rates / averages also and would like to have functionality to tweak individually to update the model if possible.
-
Would like to base the forecast on an historical average e.g. 3-6 months) but would like have the functionality to tweak this e.g. 3 month run would give $X million, a selected value would give $Ym.
Issues/Constraints:
-
Granularity is at a weekly data level with 52 weeks in year – no daily data.
-
Historical average and forecast must be on weekly Turnover.
-
Model must update to show actual whenever saved down e.g. 13 weeks of actual with remaining 39 weeks forecasted, 26 weeks of actual with remaining 26 weeks forecasted etc
-
Long-term I would like to include some logic for public holidays reducing a week to 4 days but that might become too complicated.
Any advice would be greatly appreciated or any resources I could check out?
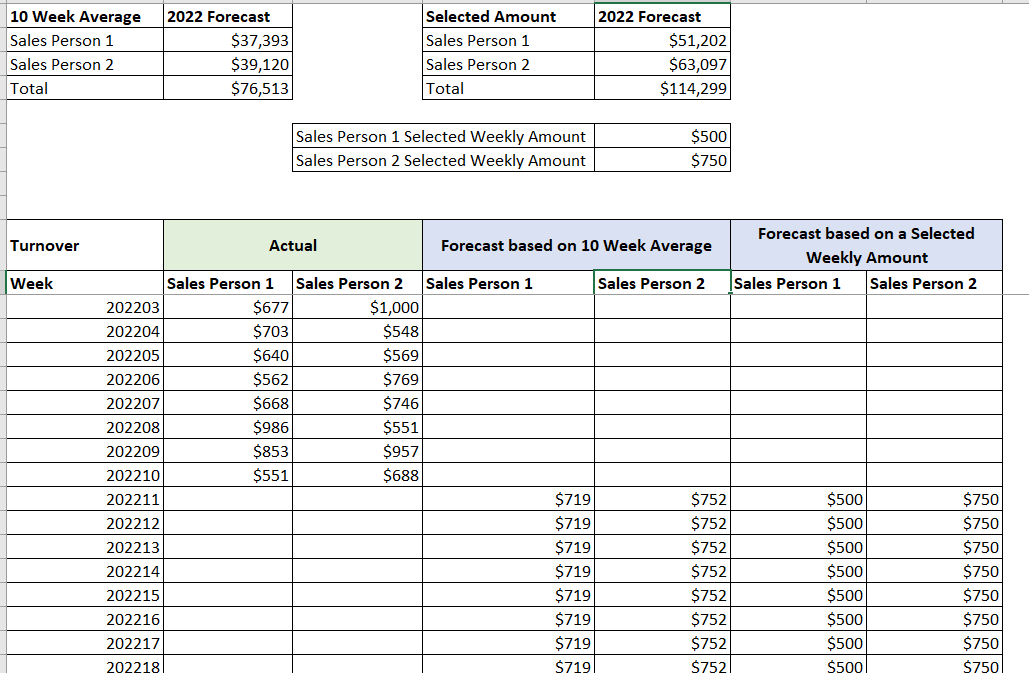
Sample of how this might look on a table below - this is just dummy data on how it might look on Excel but I need to do the forecast columns in Power BI.
| 10 Week Average |
2022 Forecast |
|
Selected Amount |
2022 Forecast |
|
|
| Sales Person 1 |
$37,393 |
|
Sales Person 1 |
$51,202 |
|
|
| Sales Person 2 |
$39,120 |
|
Sales Person 2 |
$63,097 |
|
|
| Total |
$76,513 |
|
Total |
$114,299 |
|
|
|
|
|
|
|
|
|
|
|
Sales Person 1 Selected Weekly Amount |
|
$500 |
|
|
|
|
Sales Person 2 Selected Weekly Amount |
|
$750 |
|
|
|
|
|
|
|
|
|
|
|
|
|
|
|
|
| Turnover |
Actual |
|
Forecast based on 10 Week Average |
|
Forecast based on a Selected Weekly Amount |
|
| Week |
Sales Person 1 |
Sales Person 2 |
Sales Person 1 |
Sales Person 2 |
Sales Person 1 |
Sales Person 2 |
| 202201 |
$901 |
$935 |
|
|
|
|
| 202202 |
$650 |
$760 |
|
|
|
|
| 202203 |
$677 |
$1,000 |
|
|
|
|
| 202204 |
$703 |
$548 |
|
|
|
|
| 202205 |
$640 |
$569 |
|
|
|
|
| 202206 |
$562 |
$769 |
|
|
|
|
| 202207 |
$668 |
$746 |
|
|
|
|
| 202208 |
$986 |
$551 |
|
|
|
|
| 202209 |
$853 |
$957 |
|
|
|
|
| 202210 |
$551 |
$688 |
|
|
|
|
| 202211 |
|
|
$719 |
$752 |
$500 |
$750 |
| 202212 |
|
|
$719 |
$752 |
$500 |
$750 |
| 202213 |
|
|
$719 |
$752 |
$500 |
$750 |
| 202214 |
|
|
$719 |
$752 |
$500 |
$750 |
| 202215 |
|
|
$719 |
$752 |
$500 |
$750 |
| 202216 |
|
|
$719 |
$752 |
$500 |
$750 |
| 202217 |
|
|
$719 |
$752 |
$500 |
$750 |
| 202218 |
|
|
$719 |
$752 |
$500 |
$750 |
| 202219 |
|
|
$719 |
$752 |
$500 |
$750 |
| 202220 |
|
|
$719 |
$752 |
$500 |
$750 |
Hello, @R123_Fin !
Really great question! 
I’m sure that there are plenty of different approaches, so let me share with you my personal experience and thoughts regarding your question.
- To have data on the same visual:
for this you need in your model table, which would contain:
Important:
- it is not calendar tables, just connected to it
- calendar table should have same dynamic end point (week number). So, I prefer to prepare such non-standard calendars in PQ
- forecast column should have logic equal to your business task:
a) you just want to see forecast values for future periods – could use just IF scenario (fact value = 0, forecast value, 0)
in case you’d like to add to calendar public holidays, you need to connect to some resource which have such information (web site for example), get number of non-working days per week number and use join to your main calendar
Do not forget to use RelativePath in M code, if you’d like to setup automatically data source update on PBI service.
b) you go to compare fact value with your prediction. In this case need to work around rules of prediction. From what week number we are going to run forecast
and then just add to visualization week numbers from calendar and fact and forecast from their tables
- For calculations averages it’s better to use moving averages and AVERAGEX with SUMMARIZE, to creates virtual table inside.
and touching point 3:
it’s depended on your business need, but could be realized two ways:
a) you have N number of Moving Averages measures (for 2 weeks, for 4 weeks, for 3 months or etc.)
b) or you could add a parameter to choose number of weeks / months and add parameter value to Moving Average measure
- And now, most important question.
On the first steps you’d calculated Forecast measure Value. It is ok and it works and uses your business logic (based on moving averages for ex). In what way you’re going to split total forecast value to rest of weeks for prediction? So, it should be your business decision:
- based on week-salesperson fact weight in the past
- based on sales plan week-salesperson weight
- based on different K of growth or season K etc.
Here you need to include all specific that your business has!
or you could simply add parameters just to change F values (I do not recommend, as you have 52 weeks and 10 salespersons on board).
In my opinion better to start from this point as it will be in the center of prediction logic.
Hope I could help you!
BR,
Oleg
Thank you so much for that detailed answer @Oleg.Poddubnyy
We hope this helped you @R123_Fin
If not, how far did you get and what kind of help you need further?
If yes, kindly mark as solution the answer that solved your query.
Hi Oleg,
Thank you so much for your detailed response. It is very comprehensive and I am very grateful for this.
I will work on this over the next few weeks to try and get it set up. You might see another query on this Forum from me in a couple months but this is a fantastic start for me so thanks again for all of your help!
Kind Regards,
1 Like