Hi Dan,
In my case I had the following 5 tables that I transformed and finally combined in Power Query:
- Purchaseorder lines (qty+)
- Salesorder lines (qty -)
- Serviceorder lines (qty -)
- Production consumption lines (qty - )
- Production output lines (qty +)
So I ended up with a single “Stock Movements” table that could easily be summed:
Expected stock change = SUM( 'Your table name'[Quantity] )
As for the Stock projection, I hope this simple example will help:
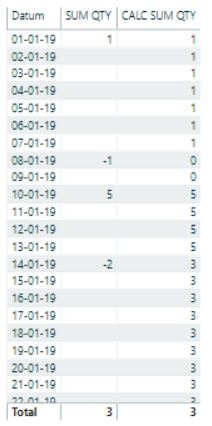
If you place the SUM QTY or [ Expected stock change ] in a table, it’ll sum up the quantity only for that day. So you need to replace that filter context and that’s where the CALCULATE, FILTER, ALL pattern comes in which allows you to sum up everything up to that point on your selected Date.
Stock projection =
VAR ExpectedChange =
    CALCULATE(
        [Expected stock change] |
        FILTER(
            ALL( Dates ) |
                Dates[Date] <=  MAX( Dates[Date] )
        )
    )
VAR StockLevel =
    CALCULATE(
        [Stock level] |
        FILTER(
            ALL( Dates ) |
                Dates[Date] <=  MAX( Dates[Date] )
        )
    )
RETURN
    ExpectedChange + StockLevel