Forecast / Project forward my stock inventory value

HI,

I am trying to figure out how i can project forwards my stock value based on my incoming materials, usage and demand.

Sounds easy as i type it however i seem to have had a brain power loss today.

I have my Current stock level id like to take the current stock value deduct the usage from our planning MRP system and then add the purchase orders that are inbound to get the expected stock level next month.

Then once i have that value, going forwards id like to predict as far into the future as my date table allows 2022 or something.

I have watched the forecasting videos but these are all based from historical data looking back over time im trying to use the actual value of my inventory and predict forwards from that.

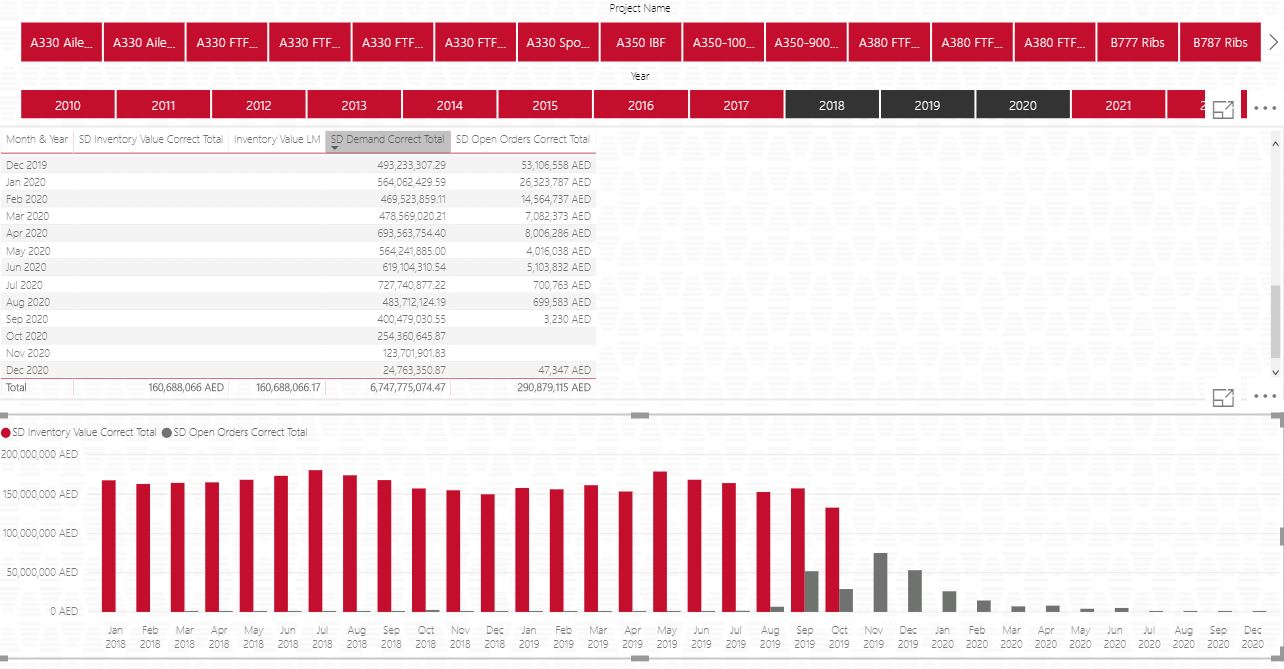
See the graph below the red is my current inventory value then grey is the open orders and there will be a blue one called demand shortly i just ran out of time. id like to project this red bar inventory value all the way through something like

Current inventory value + Open POs - demand = November Dec and so on and on

Thanks

Dan

Hi Krays23,

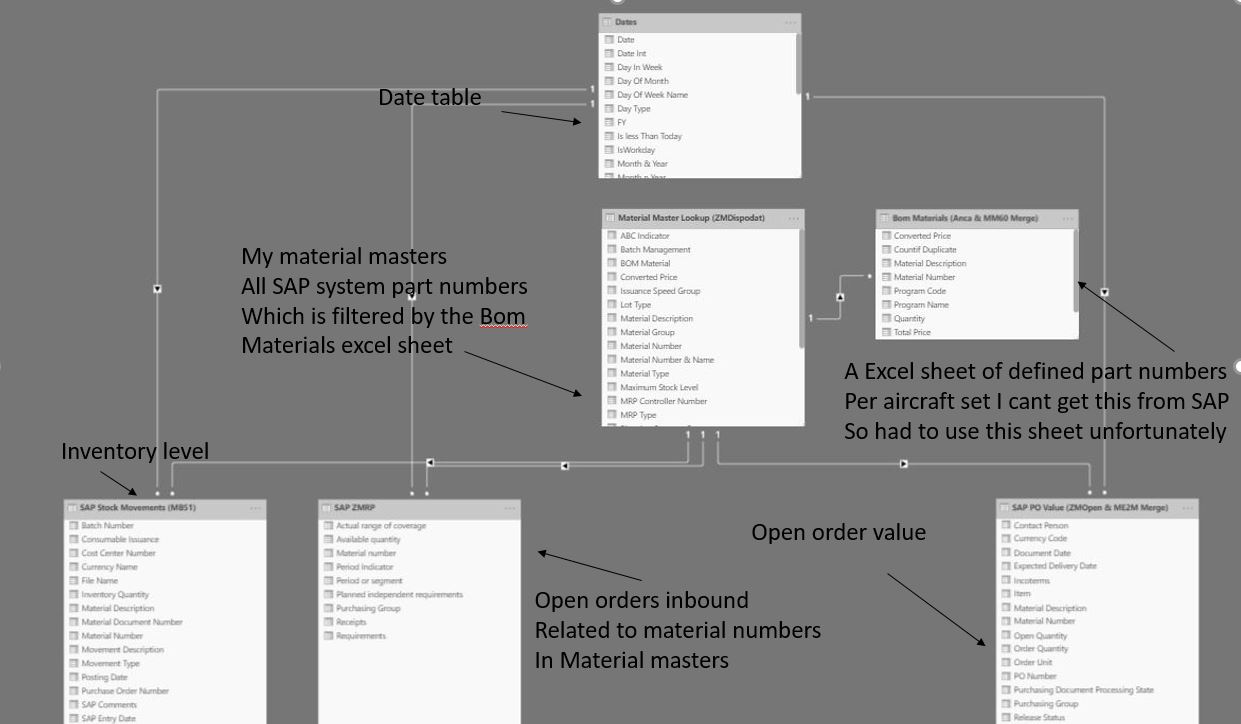
I don’t know what your model looks like but if you can create a single table with all replenishment- (positive numbers) and demand lines (negative numbers) you can just sum them up.

Expected stock change = SUM( 'Your table name'[Quantity] )

To project that on a timeline, you can do something like:

Stock projection = 
VAR ExpectedChange =
    CALCULATE( 
        [Expected stock change] |
        FILTER( 
            ALL( Dates ) | 
                Dates[Date] <=  MAX( Dates[Date] )
        )
    )
VAR StockLevel = 
    CALCULATE( 
        [Stock level] |
        FILTER( 
            ALL( Dates ) | 
                Dates[Date] <=  MAX( Dates[Date] )
        )
    )
RETURN
    ExpectedChange + StockLevel
1 Like

Hi Melissa,

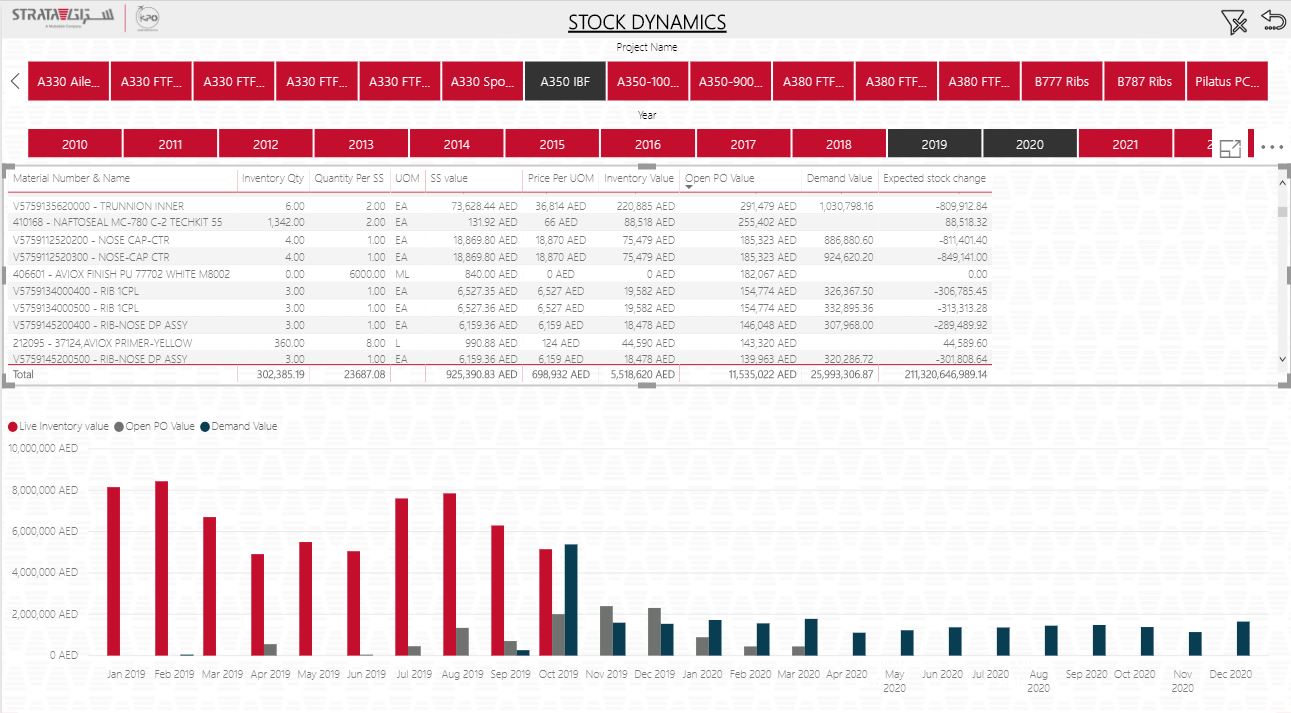
Back in the office a tried to test this out. see screen shot im almost there but i cant get the projection of “Expected stock value” to work. for some reason when i put the projection into the chart it loses the filters of the previous problem i had where by my MM list is filtered to a specific group of products and i get the expected stock of all products not the specific list.

See the graph all the data is there i just need one more column that is called expected stock which is just the stock of October - the demand (What i have to use) + the open orders (My open orders inbound for those products) and then have that projected into November then Nov in Dec and so on and on.

@Krays23,

Can you supply your PBIX with some dummy data so I can take a look?

1 Like

Hi Melissa

Sorry for the delay been trying to cut the file size down as one table is over 6 million line items! and over 200mb PBIX file!!!

Been trying to send a sample file but cant do it it messes up the data.

Im struggling to understand the stock projection side of it

Say for example my stock in Jan is 10
Then in Jan my demand to make is 5
and i have brought 10 parts and will be delivered

10 - 5 to make + 10 delivered = 15 expected stock in Feb

how do i project on feb that my stock level will be 15? and so on it goes through the year?

Is that what your trying to do here?

I included a screen shot of my model.

Expected stock change = SUM( ‘Your table name’[Quantity] ) Can you elaborate on this a bit more?

Stock projection =
VAR ExpectedChange =
CALCULATE(
[Expected stock change] |
FILTER(
ALL( Dates ) |
Dates[Date] <= MAX( Dates[Date] )

Regards

Dan

Hi Dan,

In my case I had the following 5 tables that I transformed and finally combined in Power Query:

  1. Purchaseorder lines (qty+)
  2. Salesorder lines (qty -)
  3. Serviceorder lines (qty -)
  4. Production consumption lines (qty - )
  5. Production output lines (qty +)

So I ended up with a single “Stock Movements” table that could easily be summed:

Expected stock change = SUM( 'Your table name'[Quantity] )

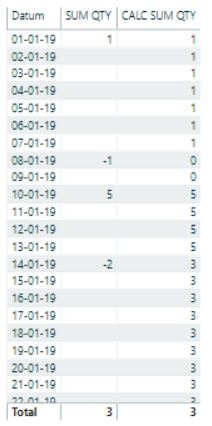
As for the Stock projection, I hope this simple example will help:
Movements

If you place the SUM QTY or [ Expected stock change ] in a table, it’ll sum up the quantity only for that day. So you need to replace that filter context and that’s where the CALCULATE, FILTER, ALL pattern comes in which allows you to sum up everything up to that point on your selected Date.

Stock projection = 
VAR ExpectedChange =
    CALCULATE( 
        [Expected stock change] |
        FILTER( 
            ALL( Dates ) | 
                Dates[Date] <=  MAX( Dates[Date] )
        )
    )
VAR StockLevel = 
    CALCULATE( 
        [Stock level] |
        FILTER( 
            ALL( Dates ) | 
                Dates[Date] <=  MAX( Dates[Date] )
        )
    )
RETURN
    ExpectedChange + StockLevel