Forecast based on current YoY growth

Hello all,

Currently I’m trying the find a sollution for the following case: I’m trying to project the total yearly sales based on the current year on year growth.

For example: today is 10-05-2021 and the (average) yoy growth in the period 01-01-2021 - 10-05-2021 = +25%.

My forecast for the rest of the year 11-05-2021 - 31-12-2021 will be “sales last year * 125%”. How is it possible to use this average yoy growth within a forecast?

Any help would be awesome!

Best regards,
Nick

@NickvanDijk,

Here are videos explaining the 4 major analyses/functions you’ll need to do this: YoY, AVERAGEX, ISAFTERTODAY and DATEADD.

If you still have questions after going through these materials, please provide a PBIX work-in-progress, and we’ll be happy to work through a specific solution with you.

I hope this is helpful.

  • Brian

Project A Current Trend Forward Repeatedly - Forecasting Techniques, Power BI.pbix (413.1 KB)

Hi @BrianJ ! I’ve watched all the video’s in the past but I’m not getting the combination of all of them. As an example I have added a pbix file from one of the videos. In this case the sales are from 1-1-2018 - 6-1-2018 and the YoY Growth is 13%. Now I would like to forecast the sales of last year x 113% for the period 7-1-2018 - 31-12-2018. I don’t know how to “freeze” that 13%.

Looking forward to your response.

Nick

Hello @NickvanDijk,

Thank You for posting your query onto the Forum.

Firstly, just to highlight here. The “13%” figure is not a constant here so let’s say if the Sales happen on 7th Jan, 2018 than that 13% figure will change and will keep on changing. So still if you want to consider the “1.13” or “13%” than just write the simple formula by mentioning the constant in it in order to iterate every row with “13%” change. Below is the measure as well as the screenshot of the results provided for the reference -

2018 Forecast - 1 = 
CALCULATE( [Total Sales LY],
    FILTER( Dates, Dates[Year] = "2018" ) ) * 1.13

Rather if you want your forecasts to be more dynamic than you can make use of “What-If” parameter in your report and place it in your measure so that it’ll be more dynamic. Below is the measure as well as screenshot of the results provided for the reference -

2018 Forecast - 2 = 
CALCULATE( [Total Sales LY],
    FILTER( Dates, Dates[Year] = "2018" ) ) +
CALCULATE( [Total Sales LY],
    FILTER( Dates, Dates[Year] = "2018" ) ) * [Forecasting Parameter Value]

To know more about this technique below are few of the links provided for the reference also please feel free to visit the education portal for more videos based on these.

I’m also attaching the working of the PBIX file for the reference as well.

Hoping you find this useful. :slightly_smiling_face:

Thanks and Warm Regards,
Harsh

Project A Current Trend Forward Repeatedly - Forecasting Techniques, Power BI - Harsh.pbix (412.4 KB)

1 Like

@Harsh
Thank you for your input and time to check this topic. I really appreciate! This two solutions are okay and I know the technique, but I would like to make this more dynamic. More like: "If last sales date = 06-01-2018, calculate the average YoY sales growth between 01-01-2018 - 06-01-2018 and use this % to forecast the sales for the whole year.

@BrianJ What is your opinion ?

Hello @NickvanDijk,

Firstly, these were the two posts wherein you suggested that you want to fix/freeze the figures in your measure> Below are the screenshots of your posts -

And based on that the solutions were provided.

Now, in the previous post you’ve suggested that you want the results to be more dynamic. Also you’ve stated that based on the results of 1/1/2018 - 6/1/2018 you want to forecast for the rest of the year as well as now you’ve an additional requirement to “calculate the average YoY Growth”. So do we’ve to presume that when sales occur on 7/1/2018 the forecast i.e. average YoY Growth then will be considered from 1/1/208 to 7/1/2018? Or it’ll still be considered from 1/1/2018 to 6/1/2018?

Lastly, can you please specify the fix set of requirements? So that members of the forum can assist you in a better manner.

Thanks and Warm Regards,
Harsh

1 Like

Hi @Harsh,

I’m sorry my question wasn’t clear enough. The dates are just an example. So for instance during the year you can calculate the YoY sales growth dynamic. For example: the last sales date is 12-05-2021 and the YoY sales growth is 50%. I would like to forecast the rest of the year (the period after the last sales date so 13-05-2021 - 31-12-2021) with this 50%. Every day this % will change because of a new YoY growth measure.

So actuals untill last sales date --> then forecast (white line) till end of the year with the dynamic YoY %

image

Best Regards,
Nick

Hello @NickvanDijk,

Thank You for clarifying the picture. So you’ll be required to write the measures for “Average YoY%” and “Forecast” accordingly. Below are the measures provided for the reference -

Avg. YoY Growth = 
CALCULATE(
    VAR _Average_Sales = 
    AVERAGEX( 
        Sales , [Total Sales] )

    VAR _Average_Sales_LY = 
    CALCULATE( 
        AVERAGEX( 
            Sales , [Total Sales] ) , 
        DATEADD( Dates[Date] , -1 , YEAR ) )

    VAR _Average_YoY_Growth = 
    DIVIDE( _Average_Sales - _Average_Sales_LY , _Average_Sales_LY , 0 )

RETURN
    _Average_YoY_Growth , 
        ALLSELECTED( Dates[Date] ) )


2018 Forecast = 
CALCULATE( [Total Sales LY],
    FILTER( Dates, Dates[Year] = "2018" ) ) +
CALCULATE( [Total Sales LY] , 
    FILTER( Dates, Dates[Year] = "2018" ) ) * [Avg. YoY Growth]

Since you suggested in the previous post that you wanted “Average YoY Growth” measure the above measure is written accordingly. If you want normal “YoY Growth” measure than remove the “AVERAGEX()” function from the formula. Below is the formula provided for the reference -

YoY Growth = 
CALCULATE(
    VAR _Sales = 
    [Total Sales]

    VAR _Sales_LY = 
    CALCULATE( [Total Sales] , 
        DATEADD( Dates[Date] , -1 , YEAR ) )

    VAR _YoY_Growth = 
    DIVIDE( _Sales - _Sales_LY , _Sales_LY , 0 )

RETURN
    _YoY_Growth , 
        ALLSELECTED( Dates[Date] ) )


2018 Forecast = 
CALCULATE( [Total Sales LY],
    FILTER( Dates, Dates[Year] = "2018" ) ) +
CALCULATE( [Total Sales LY] , 
    FILTER( Dates, Dates[Year] = "2018" ) ) * [YoY Growth - 2]

Now, the “% Growth” figure is also fixed and as the sales will happen in future the figure will keep on changing accordingly. Below is the screenshot of the results provided for the reference -

I’m also attaching the working of the PBIX file for the reference.

Hoping you find this useful amd meets your requirements that you’ve been looking for. :slightly_smiling_face:

Thanks and Warm Regards,
Harsh

Project A Current Trend Forward Repeatedly - Forecasting Techniques, Power BI - Harsh v2.pbix (410.9 KB)

2 Likes

Hi @Harsh
We are in hitting in the good direction. The next step is to “freeze” the 13% of the period of 01-01-18 - 06-01-2018. This number I would like te use for the forecast. As you see, when you extend the daterange the percentage change to -40%.

07-01-2018 45.796 * 1.13 08-01-2018 24.040 * 1.13
09-01-2018 $ 46.367 * 1.13
etc etc etc.

Hello @NickvanDijk,

Ok, so here’s the reason why that “YoY Growth” figure went negative and Forecast started to show vague results when future dates were selected. I’ve used the “Measure Branching” technique here to resolve this issue rather than writing complex formula. Let’s analyze this step-by-step. -

1). We’ve Sales till 6th Jan, 2021 so the sales measure is like this.

Total Sales = 
SUMX( Sales , 
    Sales[Quantity] * RELATED( 'Product'[Current Price] ) )

2). Now, to calculate the Total Sales Last Year. This is formula which we use in normal circumstances -

Total Sales LY - 1 = 
CALCULATE( [Total Sales] , 
    DATEADD( Dates[Date] , -1, YEAR ) )

Now, if you observe when slicer is selected for future dates i.e. after 6th Jan, 2021. We don’t have Sales for the current year but it’ll show the Sales figure of the Last Year. Below is the screenshot provided for the reference -

Sales Current Year and Last Year

3). Since we want to calculate the “YoY Growth” where there’s a Sales for the current year and than we want to comapre that with the last year. The formula for “Total Sales LY” should have been like this -

Total Sales LY - 2 = 
IF( ISBLANK( [Total Sales] ) , 
    BLANK() ,
    CALCULATE( [Total Sales] , 
        DATEADD( Dates[Date] , -1 , YEAR ) ) )

Now, if we check the results see what happens -

If you observe carefully, although now we’ve “Total Sales LY - 2” till 6th Jan’2021 the grand totals show incorrect results i.e. they are still showing the results till 10th Jan, 2021. And this is where the things started to go downhill. So firstly, now, we’ll have to correct the grand total of the “Total Sales Last Year - 2” measure.

4). To fix the grand totals of the “Total Sales LY - 2”. Below is the measure provided for the reference -

Total Sales LY - Totals = 
SUMX(
    SUMMARIZE(
        Dates , 
        Dates[Date] , 
        "@Totals" , 
        [Total Sales LY - 2] ) ,
    [@Totals]
)

Note: To fix the totals, one of our expert @Greg has already created a magnificent post which covers everything about how to fix it. Below is the link provided for the reference.

Now, see the results after writing this measure -

5). Now, let’s move ahead with the “YoY Growth” measure -

So logic of YoY Growth is like this -

YoY Growth = DIVIDE( Current_Year_Figures - Last_Year_Figures , Last_Year_Figures , 0 )

Since our last year figures i.e. “Total Sales LY” figures were incorrect. Current Year figures were getting wrongly subtracted in the “Numerator” and were also getting wrongly divided into the denominator as well. So since we’ve already corrected our “Total Sales LY” by writing the above formula. The “YoY Growth” measure will be like this -

YoY Growth = 
CALCULATE( 
    DIVIDE( 
       [Total Sales] - [Total Sales LY - Totals] , 
       [Total Sales LY - Totals] , 
       0 ) , 
           ALLSELECTED( Dates[Date] ) )

Now, let’s check the results of the “YoY Growth” measure. Below is the screenshot provided for the reference

So if you see now, although slicer is selected till 10th Jan, 2021 the results are evaluated and shown as per the last sales figure which happened on 6th Jan, 2021.

6). Lastly, once this problem is also fixed then we’ll write the final measure which pertains to the “Forecasting”. Below is the measure provided for the reference (The “YoY Growth” measure will be multiplied with the original measure of “Total Sales LY” since we want to forecast for future dates and “Total Sales LY” measure provides the results for the future dates.) -

2018 Forecast = 
CALCULATE( [Total Sales LY - 1] ,
    FILTER( Dates, Dates[Year] = "2018" ) ) +
CALCULATE( [Total Sales LY - 1] , 
    FILTER( Dates, Dates[Year] = "2018" ) ) * [YoY Growth]

See the results now. Below is the screenshot provided for the reference -

So all-in-all while evaluating this results several fundamentals were tested at each step.

I’m also attaching the working of the PBIX file for the reference as well.

Hoping you find this useful and meets your requirements that you’ve been looking for. :slightly_smiling_face:

Note: If you want the “Average YoY Growth” than follow the same steps to achieve that result as well.

Thanks and Warm Regards,
Harsh

Project A Current Trend Forward Repeatedly - Forecasting Techniques, Power BI - v3.pbix (409.8 KB)

1 Like

Hi @Harsh,

I’ve studied your metrics and steps and they are awesome. Thank you very much for making this clear and simple. I have another question for this case what I don’t understand well. When I change the context from “dates” to “months” the YoY Growth of 13% disappear for the rest of the year. Would be great to have a cumulative forecast (2nd image works great) and a month forecast. (1st image)


image

Project A Current Trend Forward Repeatedly - Forecasting Techniques, Power BI.pbix (413.1 KB)

Hello @NickvanDijk,

As suggested earlier, please specify your fixed set of requirements. Since your original query has been resolved please close out this thread. For any new requirements, please create new thread since only question is permissible under one thread. Lastly, before I sign off from this thread. Here’s my final solution on this thread.

When you change the context from “Dates” to “Months” you’ll also be required to adjust your formulas accordingly. Just by replacing the fields into the visualization the context will not change by default.

So since you’re changing the context at a monthly granularity you’ll be required to keep a note that Total Sales and Total Sales LY figure changes i.e. it now shows the figures for the entire month. So since it’s a monthly level granularity the “YoY Growth” changes from “1.13” to “0.81”. Below is the formula provided for the reference. Before that “Fix your totals for Total Sales LY” and than proceed with this -

YoY Growth - 2 = 
CALCULATE( 
    DIVIDE( 
       [Total Sales] - [Total Sales LY - Totals - 2] , 
       [Total Sales LY - Totals - 2] , 
       0 ) , 
        ALLSELECTED( Dates ) )

Note: The reason why “YoY Growth” went blank for the subsequent months is because inside “ALLSELECTED()” function I had mentioned “Dates[Dates]” as a reference so when you changed the Dates to Months it went blank. Now, I’ve referenced the entire date table inside the ALLSELECTED().

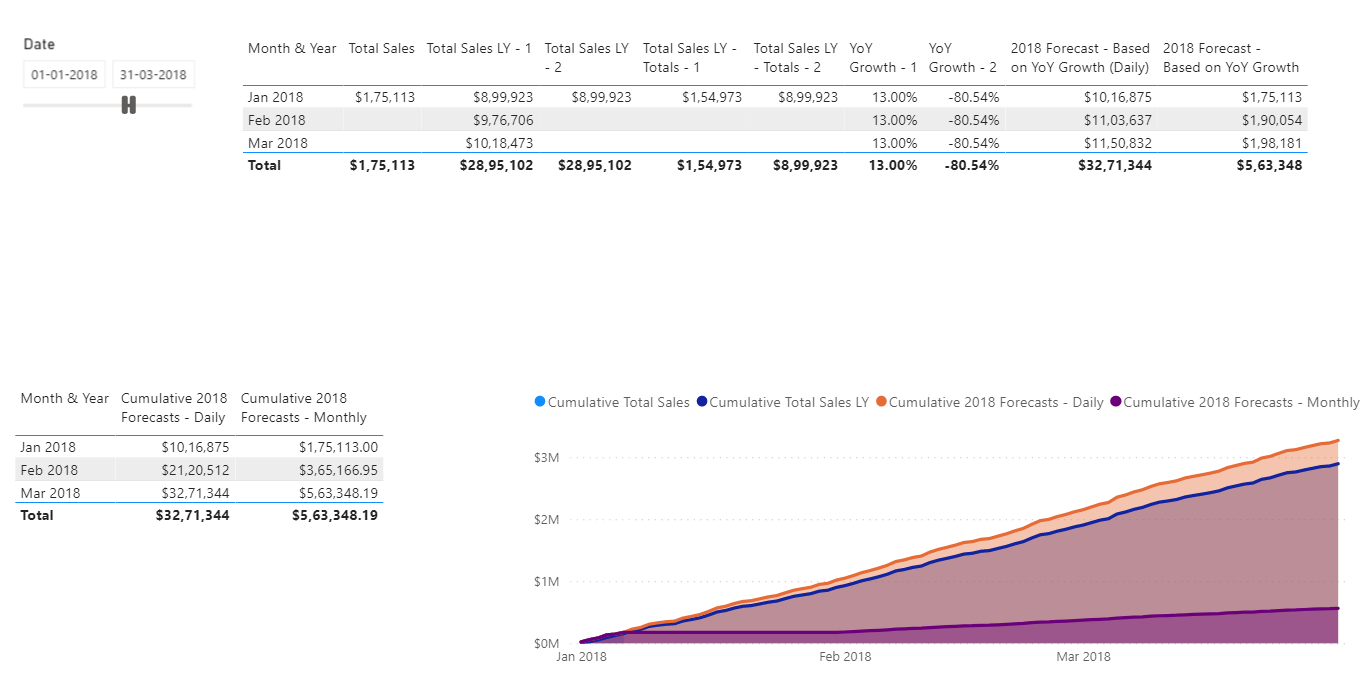
Once this is done, it’s your choice whether to evaluate the forecast at a “1.13” figure (which is at a daily level granularity) or to evaluate it at a “0.81” figure (which is at a monthly level granularity). Depending upon your further requirements create the formula’s further. Below is the screenshot of the final result provided for the reference -

I’m also attaching the working of the PBIX file for the reference. Also please go throug the education portal where there’re lot’s and lot’s of videos available which explains the concept on context. Also providing few links below of the post which one of our expert @AntrikshSharma has created which explains this concepts.

Hoping this meets your requirements. :slightly_smiling_face:

Thanks and Warm Regards,
Harsh

Project A Current Trend Forward Repeatedly - Forecasting Techniques, Power BI - arsh v4.pbix (442.0 KB)

1 Like

@Harsh Thank’s a lot for your time and explanation. I will review all the study material.

Have a great day!

Hello @NickvanDijk,

You’re Welcome. :slightly_smiling_face:

I’m glad that I was able to assist you on your query.

Have a great day and a happy weekend ahead.

Thanks and Warm Regards,
Harsh