Happy Christmas!
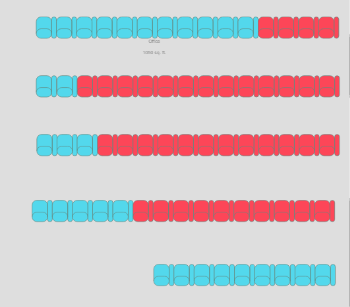
It is required to find the closest group of the students in the class for whole semester. For this purpose, Visio template is added and it gives the visualization by clicking any chair or filtering by the student or lecture date. The goal is to find the student names who sit the right and left of the selected roll number for whole semester.
The first idea is to subtract and add from the selected position in the class. For single class, the data can be retrieved from visual. But for 16 lectures, to retrieve the values seems difficult. 
This is a really interesting question, but very difficult to answer without seeing your data model, how you’re currently tracking position, etc. If you could please post your PBIX file, that will allow us to provide you much better support.
Thanks.
- Brian
Thanks. Got the file, but it’s not allowing me access to the Visio diagram. Can you please either allow me access online or attach the Visio file and I’ll re-link it to the PBIX?
Thanks.
- Brian
@BrianJ - yes this is interesting.
Now I wanted to see if I could identify the neighbours using Power Query and this is what I came up with, besides a chair offset there would also have to be a row offset because if you’re on the fist- or last chair of a row there will be only one person sitting next to you.
.
I thought you might find this helpful so here are the files.
Class room data.xlsx (12.5 KB)
Attendance Sample.pbix (629.7 KB)
Happy holidays
Nice. I worked up a DAX-based solution that takes a very similar approach. Will post later today when I get home.
- Brian
Here’s the DAX-based solution I worked up in response to your requirement. The first thing I did was add a date table and marked it as date table, to ensure any time intelligence functions worked correctly.
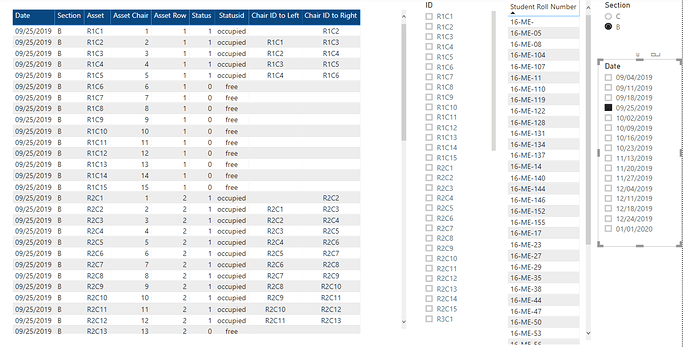
I then added a series of simple calculated columns in the Class Room table (similar to Melissa’s Power Query approach), adding columns for left and right offsets, and conditions to check for end of row left and right, as well as max chairs per row.
Next, I created two measures to calculate the left and right neighbors. They are very similar in structure, just differing in the direction of the shift and the boundary condition tests. Each one takes the selected dates, rows, chairs and students from the slicers, iterates through the relevant chairs, shifting them left or right, testing the boundary conditions to make sure the row end isn’t overrun, and then concatenates the R#C# text ID for the occupied seats to represent the left and right neighbors.
Here’s the Left Neighbor measure:
Chair ID to Left =

VAR Occupied =
SELECTEDVALUE( 'Class Attendance'[Status] )

VAR LeftShift =
SELECTEDVALUE( 'Class Attendance'[Asset Chair] ) - 1

VAR IDCalc =
CALCULATE(
    CONCATENATE(
        CONCATENATE("R",SELECTEDVALUE( 'Class Attendance'[Asset Row] )),
        CONCATENATE("C", LeftShift)
    ),
    ALLSELECTED( 'Class Attendance'[Date], 'Class Attendance'[Asset] )
)

RETURN
SWITCH( TRUE(),
    Occupied = 0, BLANK(),
    LeftShift = 0 || LEFT( IDCalc, 2) = "RC", BLANK(),
    IDCalc
)
And the Right Neighbor measure:
Chair ID to Right =

VAR Occupied =
SELECTEDVALUE( 'Class Attendance'[Status] )

VAR RightShift =
SELECTEDVALUE( 'Class Attendance'[Asset Chair] ) + 1

VAR RightMax =
LOOKUPVALUE(
    'Class Room'[Max Chair by Row],
    'Class Room'[ID],
    SELECTEDVALUE( 'Class Attendance'[Asset] )
)

VAR IDCalc =
CALCULATE(
    CONCATENATE(
        CONCATENATE("R",SELECTEDVALUE( 'Class Attendance'[Asset Row] )),
        CONCATENATE("C", RightShift)
    ),
    ALLSELECTED( 'Class Attendance'[Date], 'Class Attendance'[Asset] )
)

RETURN
SWITCH( TRUE(),
    Occupied = 0, BLANK(),
    RightShift > RightMax || LEFT( IDCalc, 2) = "RC", BLANK(),
    IDCalc
)
And here it is all put together:
Thanks – fun problem to work on. Hope this is helpful. Full solution file posted below.
- Brian
eDNA Forum - Attendance Sample - Solution.pbix (638.6 KB)
Great Work!
I couldn’t see the solution[s] in detail due to family functions.
It seems that this solution will help to automate many processes in the class management.
I am really thankful to both of you.
Thanks - that’s wonderful to hear. I’m very glad we were able to help.
Good luck with the rest of the project.
- Brian
I am trying to extract the values of the concerned roll numbers sitting left and right of the selected roll number. The logic is that if any roll number is selected then the near by students should be filtered in a tabular value for all lectures or for selected lectures.
Now, the issue is that when I try to write DAX expression, it filters the seats not the students. Second, I want to count the student roll numbers who sit adjacent to any pivoted student. It will eventually provide some clusters of the closest friends.
FYI - I’ve worked up a full solution that returns student roll numbers and neighbor counts. Just need to do some final checking to make sure everything’s working as expected. Should have it for you Thursday afternoon EST.
- Brian
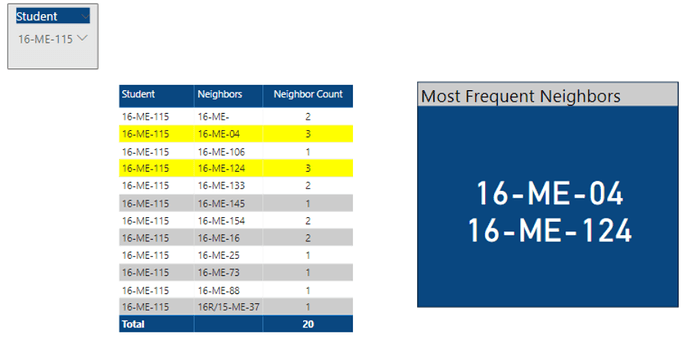
OK, I got really intrigued by this problem, so I put together a full solution that went even beyond your original requirements - hopefully, you’ll find it all helpful. Here’s a snapshot of the end product, which for any student selected returns a table of all of their immediate (right or left) neighbors over all dates and lectures, how many times they sat next to each neighbor, and highlights and puts into a card the student IDs of their most frequent neighbor(s):
Here’s a rundown of the approach I took in putting this together (warning: long post ahead, full solution file is attached at the bottom).
Before jumping into the analysis itself, I took the following steps in Power Query:
- In the Class Attendance table, I created an Event ID field, merging the information on lecture, section and date to create a unique identifier for a given class. This will be needed later to look up student names based on chair IDs
- Created a Students dimension table, composed of the distinct values on student roll number in the Class Attendance table and then incorporated this into the data model
- Created a supporting table called Neighbor Lookup that will be used later to look up the values for student names in neighboring chairs
- Reworked the relationship between Class Room and Class Attendance. ( You were previously using key in this table at the chair level, when I think it needs to be at the room level)
I also decided that the neighboring left and right chair identification would also best be done as a column in the Class Attendance table, rather than as a measure. In the solution file below I rewrote my measure code as as calculated columns. Alternatively, you can do this in Power Query using the approach @Melissa provided in a prior post in this thread.
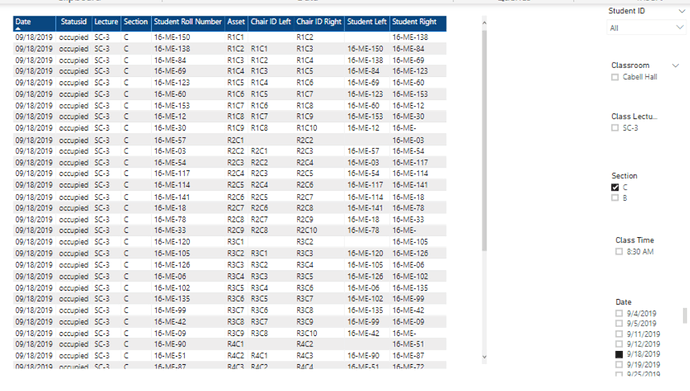
Next, I added two calculated columns to the Class Attendance table, which look up the student roll number for the left and right neighbors. This is done using the supporting Neighbor Lookup table, the neighboring chair IDs and the Event ID created above. The combination of these produce a unique name for a given class on a specific date. Here’s the right neighbor lookup calculated column DAX code (the left lookup is nearly identical):
Student Right =

VAR ChairLookup  = 'Class Attendance'[Chair ID Right]
VAR CurrentEvent = 'Class Attendance'[Event ID]

RETURN
SWITCH( TRUE(),
    'Class Attendance'[Chair ID Right] = BLANK(), BLANK(),
    'Class Attendance'[Status] = 0, BLANK(),
    CALCULATE(
        SELECTEDVALUE( 'Neighbor Lookup'[Student Roll Number] ),
        'Neighbor Lookup'[Event ID] = CurrentEvent,
        'Neighbor Lookup'[Asset] = ChairLookup
        )
)
So, now we have the ability to calculate the left and right neighbors (chair IDs and student IDs) for any and all students selected via the various slicers:
Halfway home. Now on to analyze the neighbor data, which is where it gets really interesting…
The first step here was to create a cross joined table composed of every student in the Student dimension table crossed with every student who showed up as a left OR right neighbor of another student. Here’s the DAX code to create that supporting table:
Neighbor Crossjoin =

CROSSJOIN(
    Students,
    DISTINCT(
        UNION(
            DISTINCT( 'Class Attendance'[Student Left] ),
            DISTINCT( 'Class Attendance'[Student Right] )
        )
    )
)
Now to that table I added a calculated column, which for every student in the first column of the table, calculated the number of times they sat next to each student in the second column, iterated over the entire Class Attendance data set:
Neighbor Count =

CALCULATE(
    COUNTROWS(
        'Class Attendance'
    ),
    FILTER(
        ALL( 'Class Attendance' ),
        'Class Attendance'[Student Roll Number] = 'Neighbor Crossjoin'[Student1] &&
        ('Class Attendance'[Student Left] = 'Neighbor Crossjoin'[Student 2] ||
        'Class Attendance'[Student Right] = 'Neighbor Crossjoin'[Student 2])
    )
)
Next, I created a measure that calculated for every student the max count of the calculated column above:
Max Neighbor Count by Student =
CALCULATE(
    MAX( 'Neighbor Crossjoin'[Neighbor Count] ),
    ALLEXCEPT(
        'Neighbor Crossjoin',
        'Neighbor Crossjoin'[Student1]
    ),
    ALLSELECTED( 'Neighbor Crossjoin'[Student1] ),
    'Neighbor Crossjoin'[Student 2] <> BLANK()
)
(One side note about this measure - the last filter condition excludes the results where a student’s most frequent neighbor is an empty chair. I got the impression from our conversations above that you are looking for only most frequent actual human neighbors. If you want to find/show “blank” (i.e., empty chair) as someone’s most frequent neighbor, you can just delete or comment out this line).
Branching off of this max count measure, I created two final measures. The first is used in field-based conditional formatting to highlight the most frequent neighbor(s) line(s) in yellow:
Highlight Row =
IF(
    SELECTEDVALUE( 'Neighbor Crossjoin'[Neighbor Count] ) = [Max Neighbor Count by Student],
    "Yellow",
    BLANK()
)
The second is used to concatenate the student IDs of the most frequent neighbor(s) of a given student for placement in the card visual:
Most Frequent Neighbors by Student =

CALCULATE(
    CONCATENATEX(
        'Neighbor Crossjoin',
        'Neighbor Crossjoin'[Student 2],
        UNICHAR(10),
        'Neighbor Crossjoin'[Student 2],
        ASC
    ),
    FILTER(
        'Neighbor Crossjoin',
        'Neighbor Crossjoin'[Neighbor Count] = [Max Neighbor Count by Student]
    ),
    ALLEXCEPT(
        'Neighbor Crossjoin',
        'Neighbor Crossjoin'[Student1]
    ),
    ALLSELECTED( 'Neighbor Crossjoin'[Student1] )
)
So, I hope you find this useful. Feel free to give a shout if you have any questions or problems. Thanks for a really thought-provoking problem – I had a lot of fun with this one…
- Brian
eDNA Forum - Attendance Sample - Return Names Solution.pbix (667.8 KB)
It’s really awesome and beyond my expectation. I am starting experimenting based on this logic. I am confident that this really provides the insights of class behavior. I will get back to you as soon as I am done.
I am very thankful to you and Melissa for taking time to solve this cumbersome problem for me.
Kindest Regards,


