I’m having the same issue showing this year vs previous year units sold using a custom 445 fiscal calendar. I’d like to be able to show current vs previous year sales within a hierarchy (year, quarter, month, week). This is very easy to achieve with a standard calendar, but I’m struggling to do the same with a fiscal calendar.
I’ve watched some of the videos on Enterprise DNA. I was able to successfully look at a single granularity of data (current week vs same week last year, or current quarter vs same quarter last year), however when I try to place these aggregations in a hierarchy on a table or bar chart, it doesn’t work.
I’ve attached a sample pbix file which contains a simple data model with my 445 date table (the fiscal dates are labeled FiscalYear, FiscalQuarter, etc.)., plus a transaction table (units sold = sum[units sold]. I’m hoping someone can show me how to create a dax formula that allows the user to view current vs previous data within a hierarchy based on the fiscal calendar.
So far, I’ve tried the following dax, which work only in one granularity: either year OR week, but I can’t stack these into a hierarchy to move up and down the date hierarchy. This version works with current vs previous year, but not the other levels of the date hierarchy:
Units Sold Previous FY = CALCULATE([Units Sold], filter(all(dates), dates[fiscalyear]=MAX(Dates[FiscalYear])-1) )
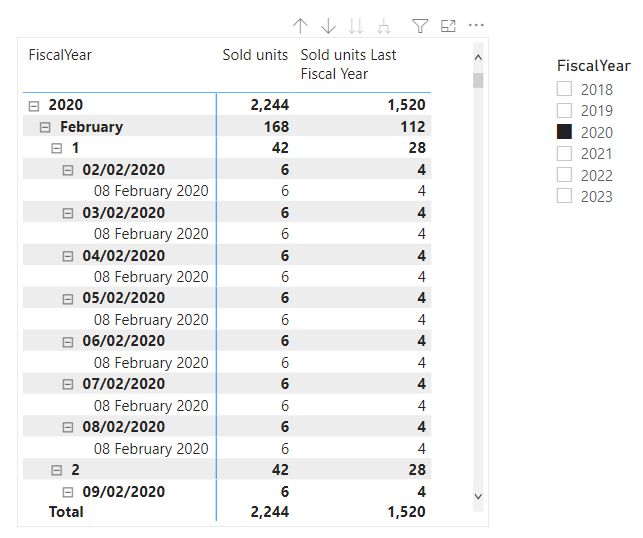
This next bit of DAX, which I found on enterprise DNA, works for comparing this week vs the same week last year, but you can’t drill up from week to month to quarter to year, as it returns blanks when you leave the week level of the hierarchy:
Units Sold PY Fiscal 1 =
var currentfiscalweek = SELECTEDVALUE(DatesPrim[FiscalWeeknum])
var currentfiscalyear = selectedvalue(DatesPrim[FiscalYear])
return
CALCULATE(’+Measures’[Units Sold],
FILTER(ALL(datesprim),
DatesPrim[FiscalWeeknum] = currentfiscalweek &&
DatesPrim[FiscalYear] = currentfiscalyear - 1) )
Thank you for your help!
Pete
Fiscal Cal Sample.pbix (704.8 KB)