The AR data sets created by a software program has numerous mathematical issues. Negative values & values multiplying themselves each time a claim is resubmitted.
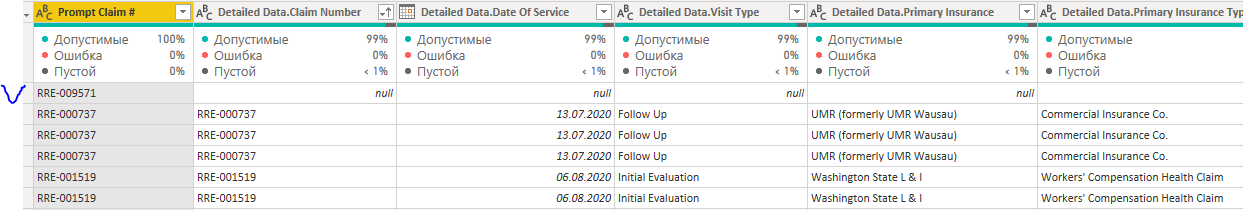
I have figured out a way to use the visit data to calculate the correct gross billable claim number and then join this data to the open AR claim numbers and create an ‘aging’ report that shows a more accurate gross AR number.
My biggest concern was whether there was any possibility that join would miss records as this software is so poorly designed.
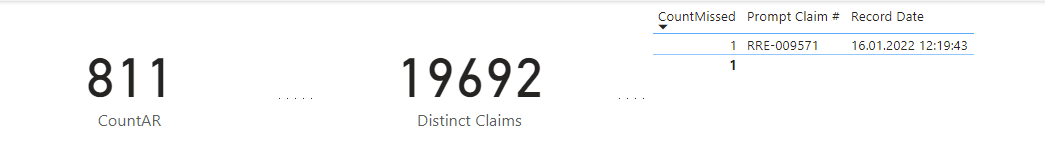
I did a count and a distinct count on the data and found there is a 1 record in AR but not in visit datal.
I extracted the results and did a vlookup to figure out which claim is missing in the visit data (Claim #9571 is the issue)
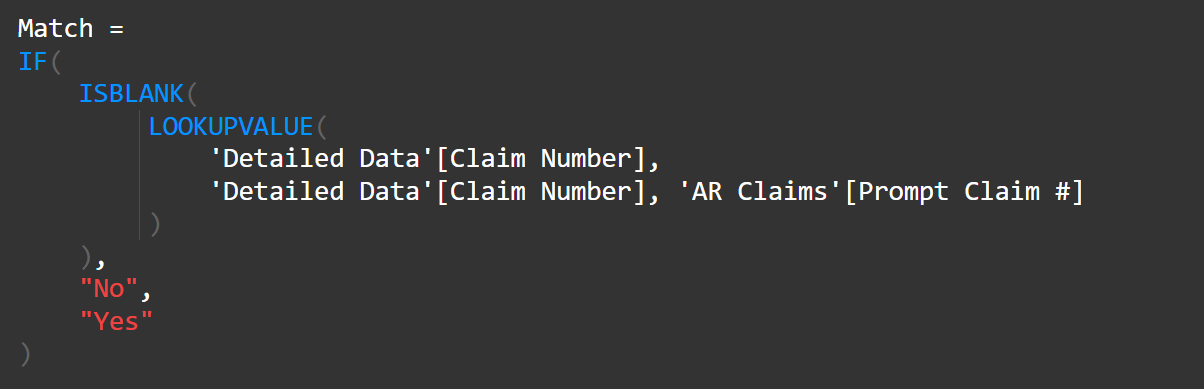
Which leads me to wonder is there a way to create a DAX measure that would highlight any mismatches of the extracted data w/o having to bring data into excel as I expect there will be other mismatches downstream. The detail data has many records that are ‘closed’ and no longer relevant to AR calculations which messes me up when trying to think through an ‘if’ statement assuming that’s the best path but I suspect there’s a much cleaner way to get this data.
AR Test File.xlsx (68.5 KB)
DetailTestData.xlsx (2.3 MB)
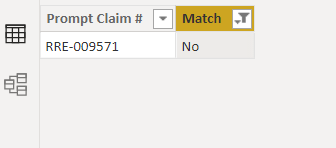
In short for this example I want to have a visual that would show ‘claim 9571’ as the data mismatch.
Excel data & PBIX attached.
Thanks in advance.
AR Adjustment Test.pbix (695.5 KB)