Hi @AndrewRizk.
I finally had a few minutes to look at your second issue. Here’s what I came up with:
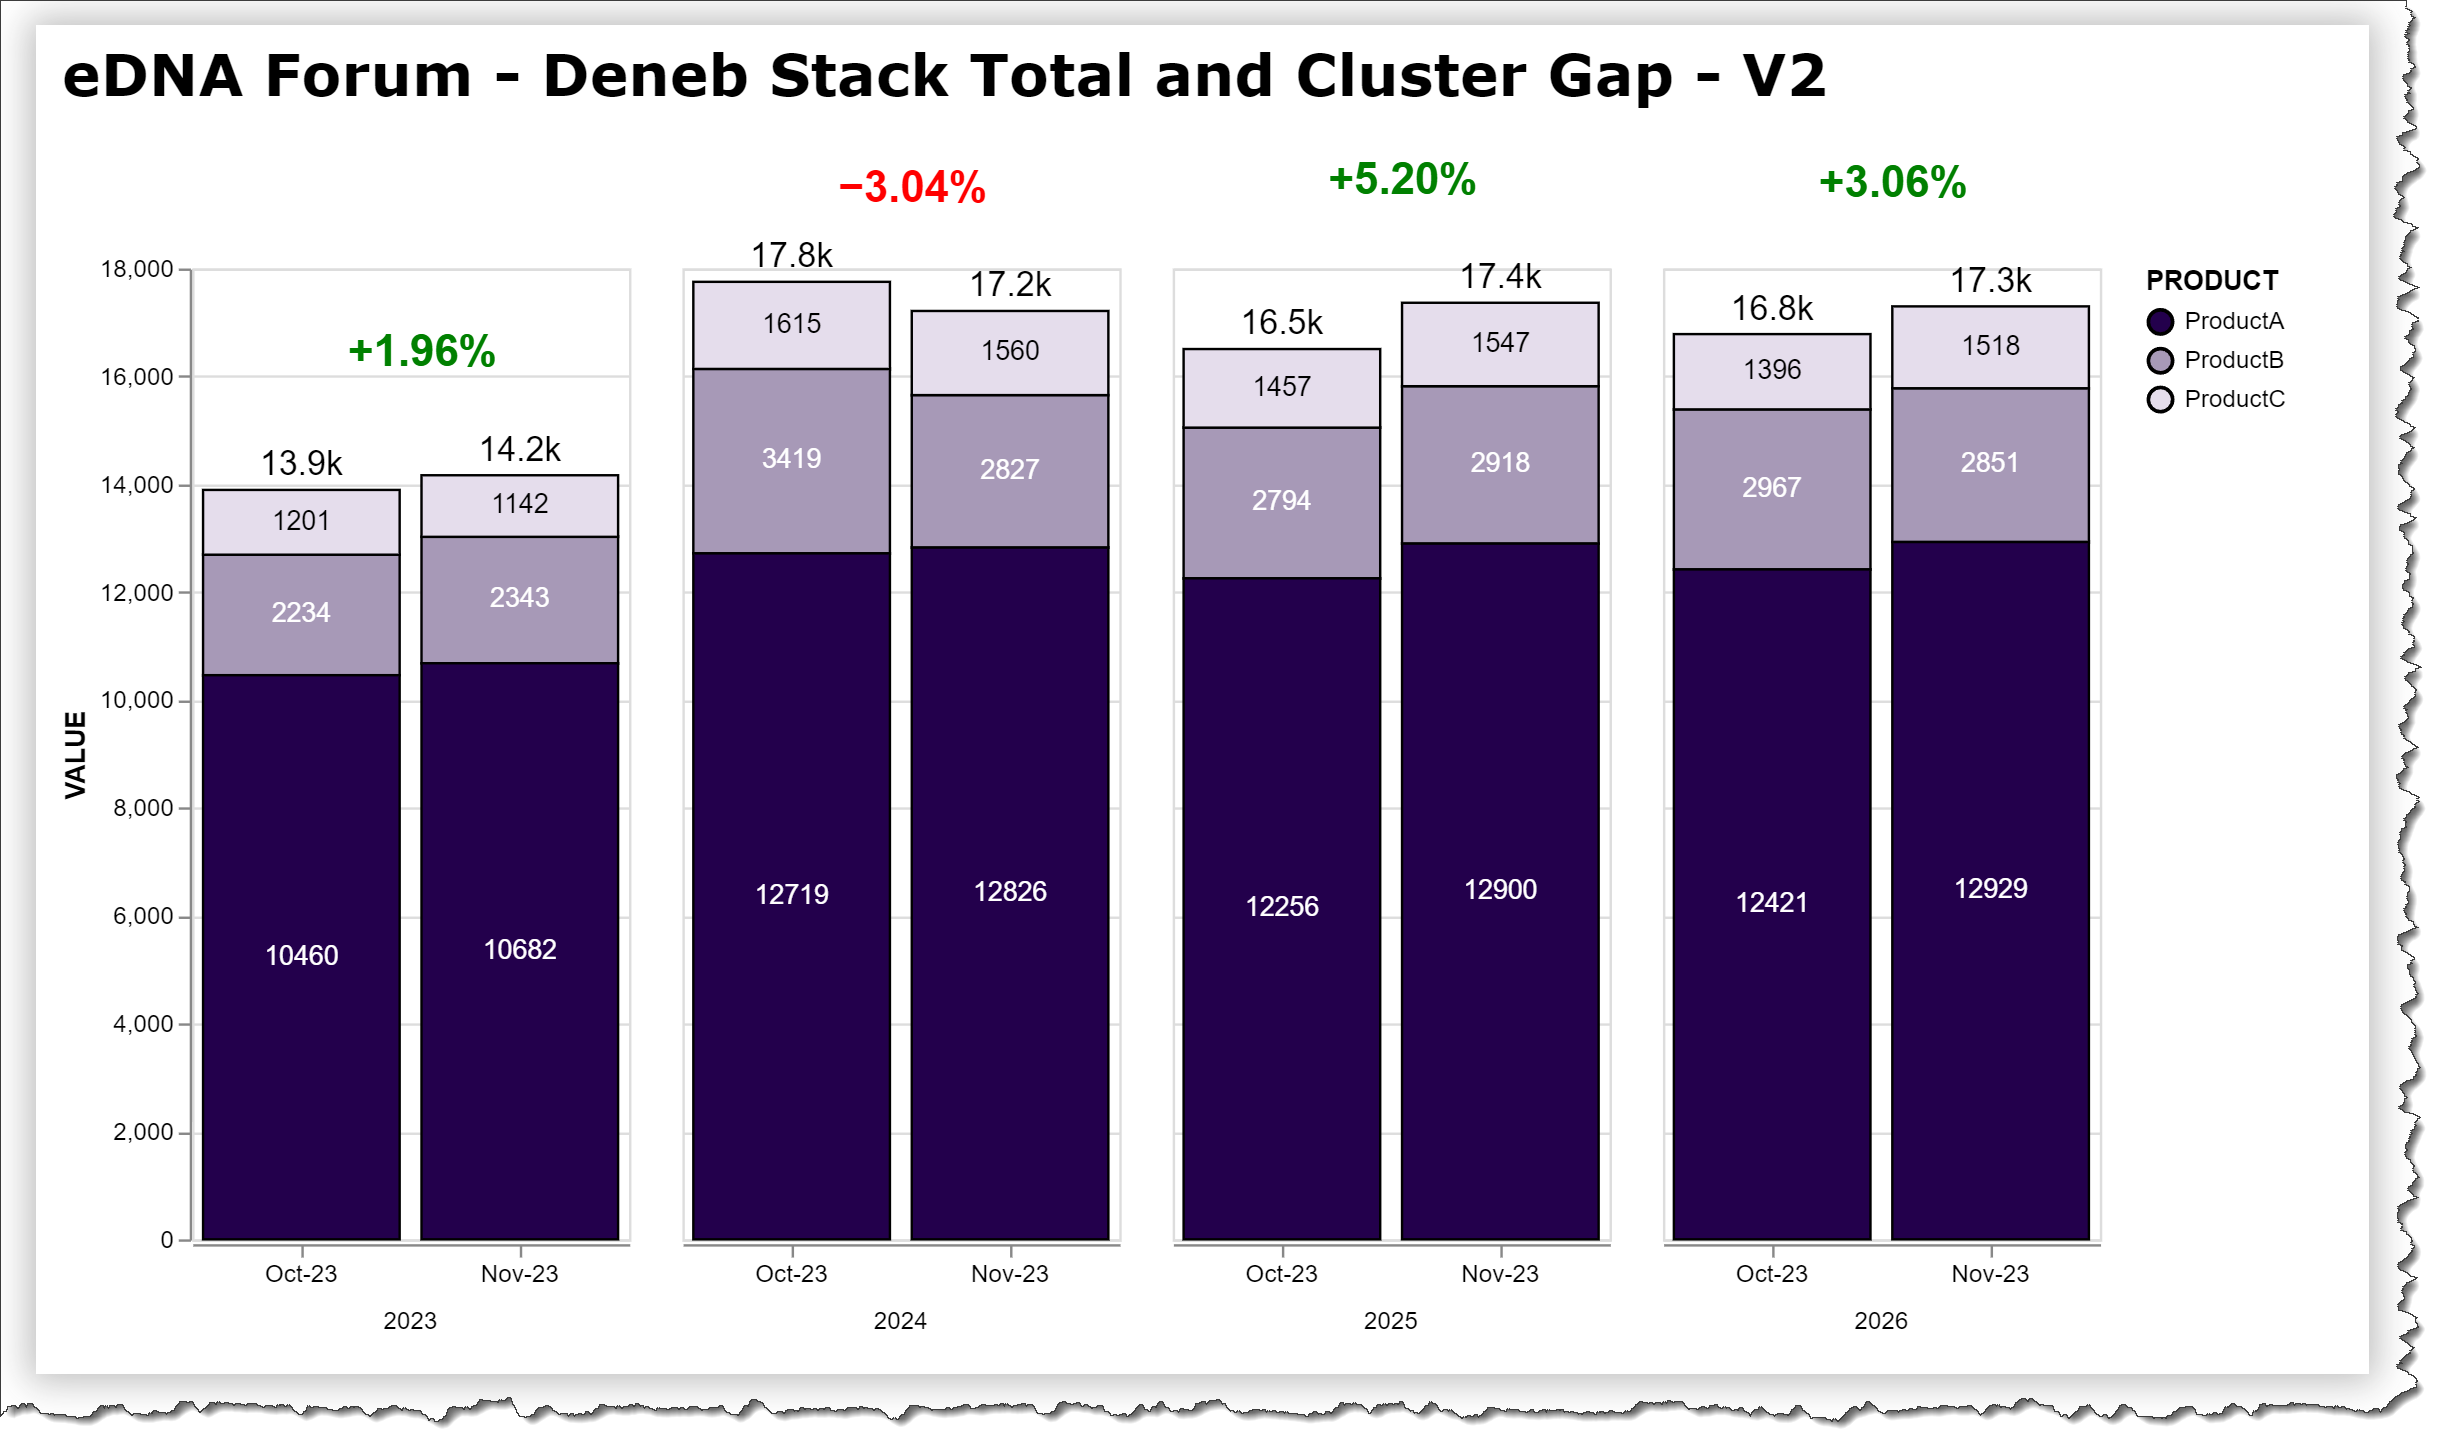
A little restructuring of the transforms and layers was required, but the full solution is essentially:
- continue with your layer in your spec block as per your original (with the existing “bar” and “text” marks)
- add a new block to the layer with:
- transform block with:
- aggregate/sum for total stack value
- window/lag for previous total stack value
- calculate for variance
- calculate for variance percent
- layer block with:
- “text” mark for stack total value
- “text” mark for stack total variance value (positive=green, negative=red)
- transform block with:
As for the leader lines to the stack total variance value, you’ll need a series of “rule” marks, and it would likely be a bit of an effort and would depend on your data. You can refer to the existing “Line Chart with Min-Max Variance” post in thee Deneb Showcase for further details.
Hope it helps.
Greg
eDNA Forum - Deneb Stack Total and Cluster Gap - V2.pbix (1.5 MB)