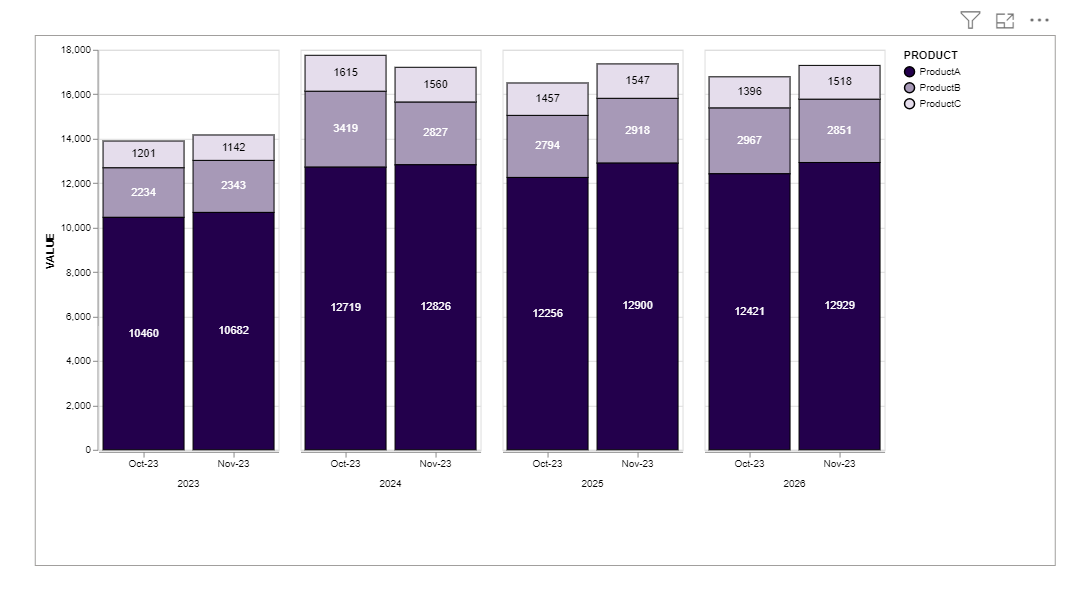
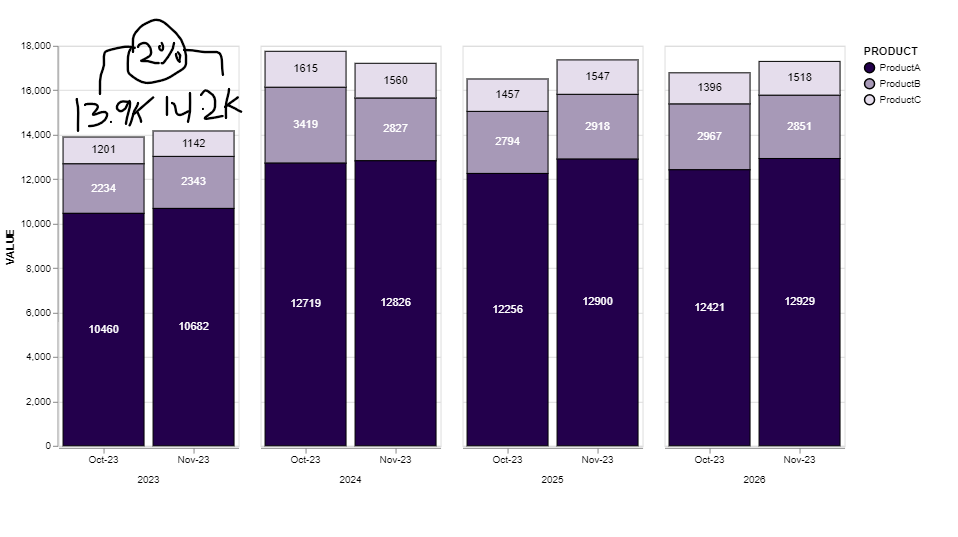
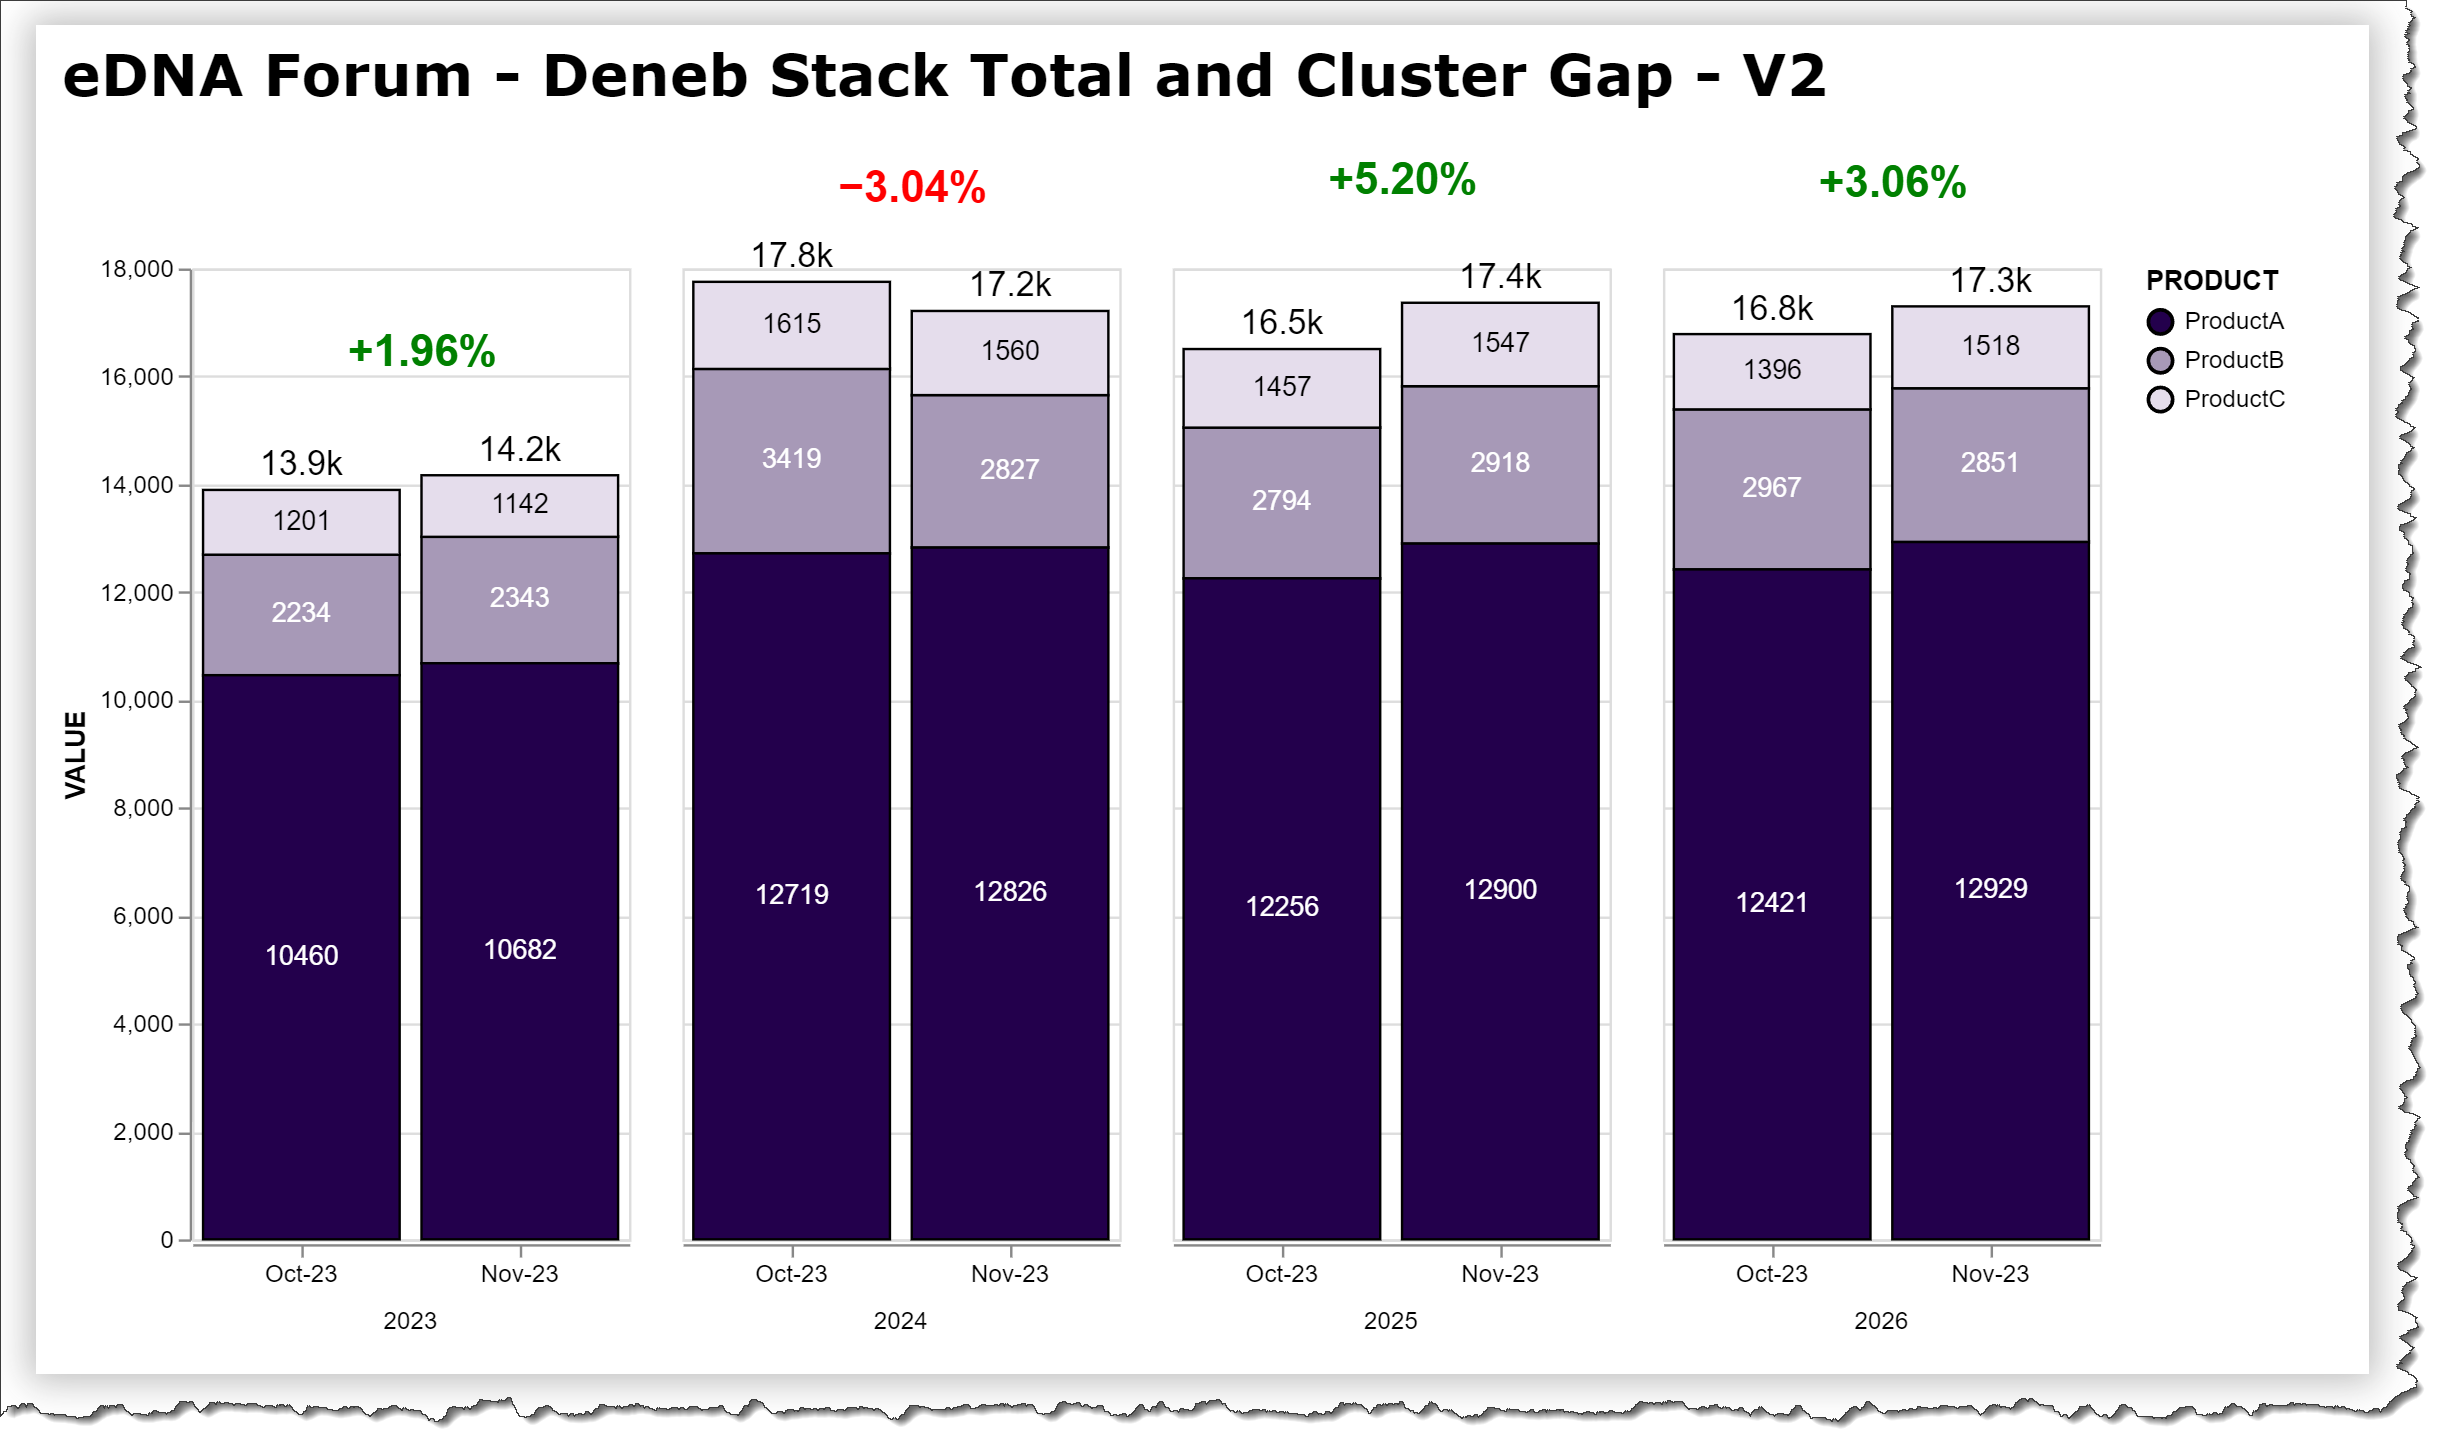
I have been trying to create a graph that compares two sets of data (One being in October and one being in November, shown below referred to as SUBMISSION). Each set has sales of ProductA, ProductB, ProductC and I am trying to compare them and visualize the total on the top as well as show a percentage of difference by year on top of each two-bars if possible as shown in the second chart. So far I have the first example and I would like to add the total and the difference if possible. I am copying my code below for reference. Thank you!
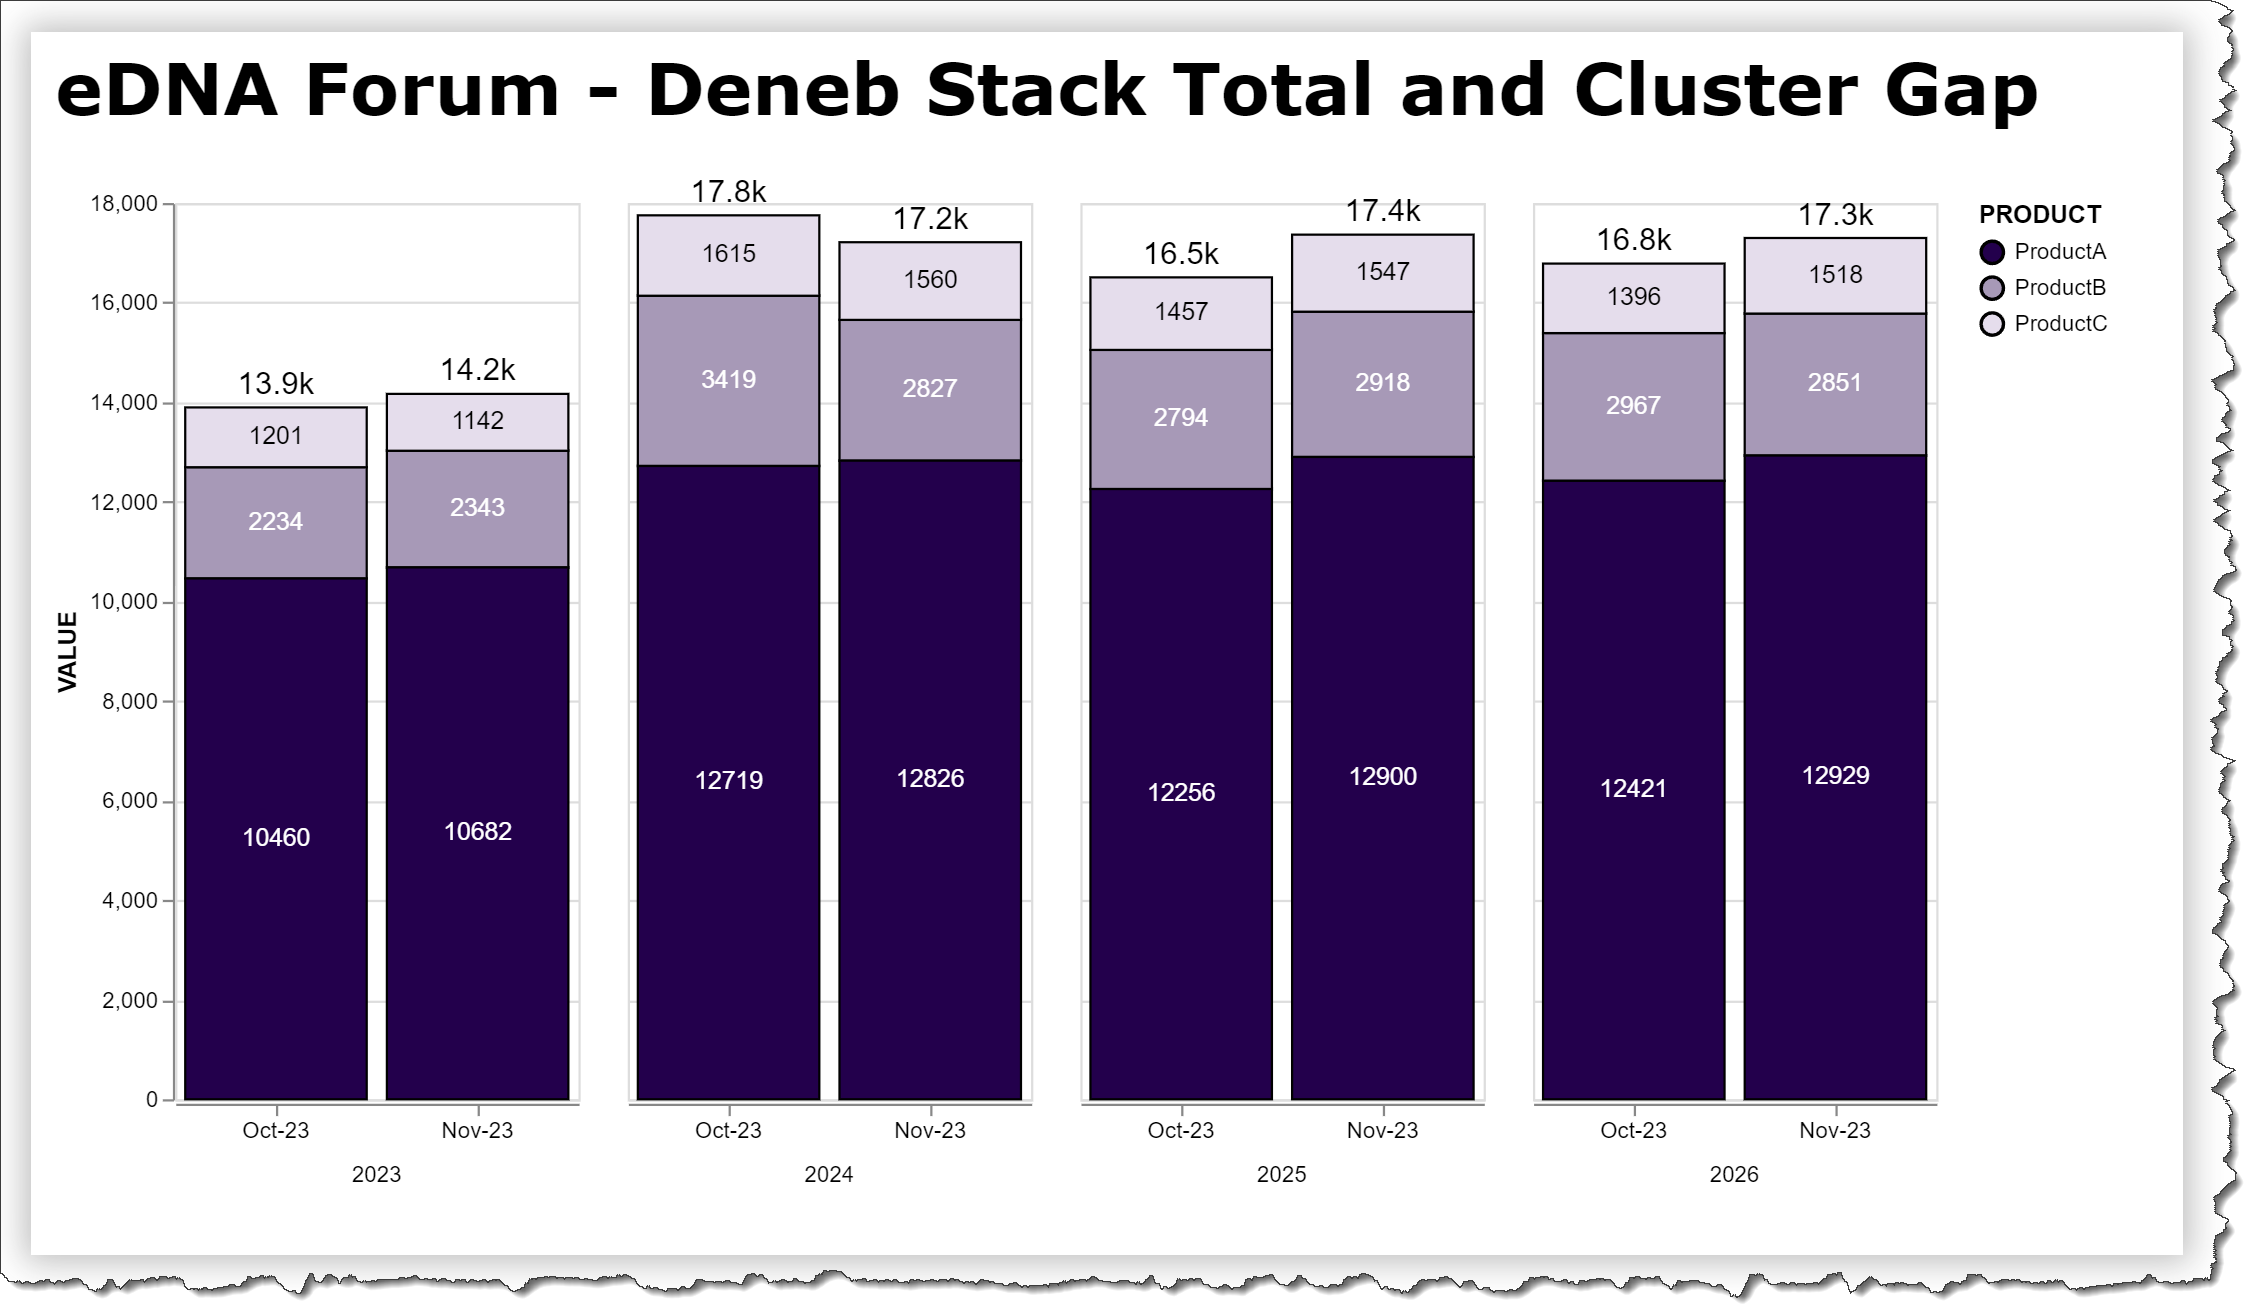
Only had a few minutes to pursue your 2 issues, and have a quick fix for the first: to add the stack total, add another text mark with an aggregate transform to reduce the dataset appropriately.
That does it!! Thanks a lot Greg.
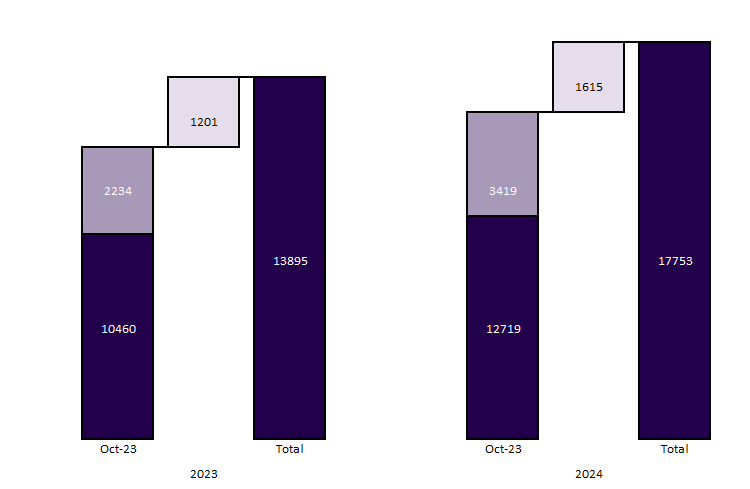
Meanwhile, do you know if it is possible in Deneb to do something similar to the above however one bar would represent Oct-23 Submission for example showing the total the 2 stacked blocks as above of Product A, Product B, and Product C as an increase (Waterfall-like).
A little restructuring of the transforms and layers was required, but the full solution is essentially:
continue with your layer in your spec block as per your original (with the existing “bar” and “text” marks)
add a new block to the layer with:
transform block with:
aggregate/sum for total stack value
window/lag for previous total stack value
calculate for variance
calculate for variance percent
layer block with:
“text” mark for stack total value
“text” mark for stack total variance value (positive=green, negative=red)
As for the leader lines to the stack total variance value, you’ll need a series of “rule” marks, and it would likely be a bit of an effort and would depend on your data. You can refer to the existing “Line Chart with Min-Max Variance” post in thee Deneb Showcase for further details.
Your “meanwhile” issue is an entirely new question. If the answer given in this thread solves you original issue, please mark the thread as solved and create a new thread for the new question with supporting uploads (you have the expected outcome image already, but provide as well the dataset and PBIX file).
Just a small follow up on the same pbix here. Why do you think the opacity feature is not working? I have set it up in the transform as well in the encoding. I did make it work before but I am not sure where I went wrong after. Thank you!
Hi @AndrewRizk. No idea. I tried several forms, but couldn’t get the opacity to work either. I expect it has something to do with the facet/spec, but have no insight. Greg