I’m trying to figure out how to calculate the difference between the current row’s date, and the nearest date in a sales table, for a given customer ID.
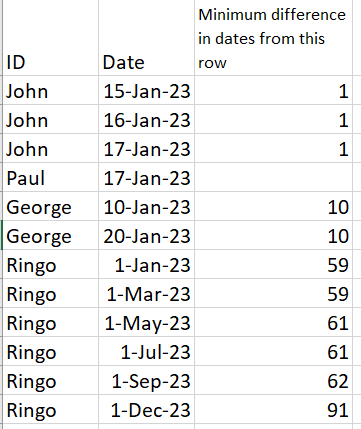
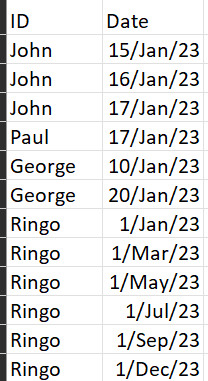
For simplicity, the interim result would look like the following toy data (file below):
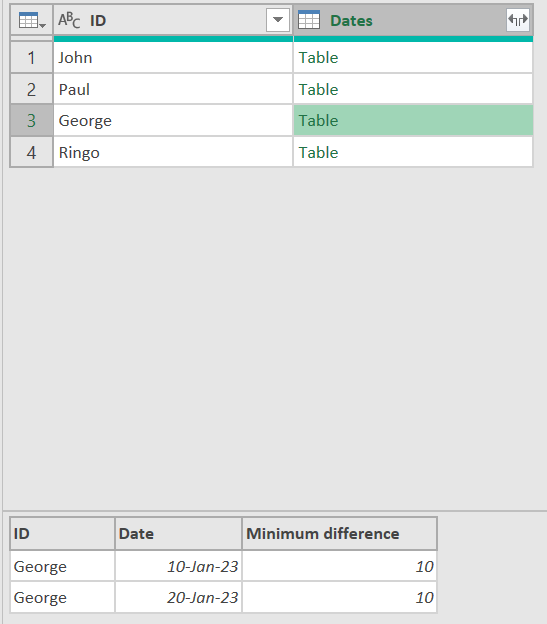
I think I need to create a table with the rows grouped by the customer:
and then merge this table back to the main table, finding the minimum difference in days between the current row and the merged table (excluding the date for the current row), but this is beyond me.
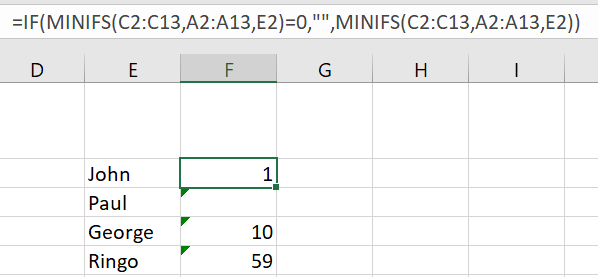
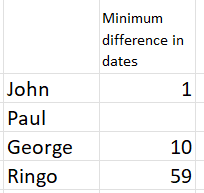
I think that the final step would then be to find the minimum for the table that wasn’t 0 as I’d do in Excel here:
toy_data.xlsx (10.1 KB)
Any help gratefully received here
Thanks,
Rod
toy_data.xlsx (22.0 KB)
Here is my try at this, just to point out you could use table.nestedjoin to get the results back into the customers table, I went with table.selectrows, im not sure which would work better to be honest.
The logic I used was the minimum date for each customer that was strictly greater than the current row, which meant the last row for each customer would be null as there is no next greater record, it doesnt match your example table as Ringo has 91, unless there are records not in the set, but the results seem to be correct.
Hopefully this points you in the right direction, or helps others to give you an answer 
Thanks Kylie, and apologies for not making myself clear here, completely my fault.
The question was meant to be how could I get from the source transaction table (Columns A & B only in the toy data set):
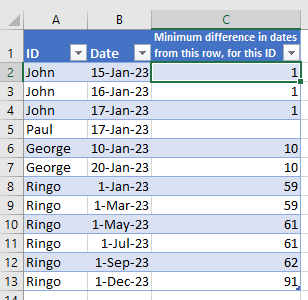
to the final solution of columns E and F:
I had thought that an interim step would be figuring out how to make the table in columns A, B, and C which I could then group by, but I can’t figure out how to get from columns A and B to columns A, B, and C.
Any thoughts on how to do this?
toy_data.xlsx (24.2 KB)
I added a transform sales function query, you would use the same logic, your would still be grouping the sales table and running a function over the group, the only difference would be you are not merging back to the table, its the same technique only we are not creating the temp table to merge to a dimension so can run table.group in the sales query and transform the table so no record is needed as an interim step.
Hope that helps.
Hey Kylie,
Thanks indeed for your time on this, and apologies for my poor descriptions, but looking through your queries I think you are using the interim step that I simply manually entered in your query (the “sales” table in your query).
The only source data for this query will be the xlsx sales table:
Toy_Data_Source.xlsx (9.0 KB)
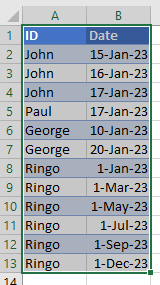
What I’m trying to do is figure out how I can end up with a table summarising the minimum time between the current row dates and any other date for this ID, the resulting table (that I’m trying to create) would be this:
Toy_Data_Result.xlsx (10.1 KB)
I think by “showing my work” I have confused this process and wasted your time.
Apologies again for this, and thanks for your help, it’s greatly appreciated,
Rod
toy_data.xlsx (25.1 KB)
I have amended the logic, the only thing is that it is hard to get 10 for george on the first dat because there are no other dates at that point in time, so the minimum is null at that point.
toy_data.xlsx (27.1 KB)
There is also another way to phrase this, and that is the difference between the current rows date and the previous rows date, as that would always be the minimum difference as long as they were in date order, I ran another query with this logic and got the same results, and same limitation that the first date in the serious doesnt have a comparison.
Hello @rodwhiteley
Did the responses above help solve your query?
If not, can you let us know where you’re stuck and what additional assistance you need?
If it did, please mark the answer as the SOLUTION by clicking the three dots beside Reply and then tick the check box beside SOLUTION
Thank you
Sorry, the solution provided didn’t do what I wanted, which is because I didn’t explain things well - essentially the provided solution uses the artificial column that I created as an interim step as a source (the “minimum difference in dates from this row” from the “Sales” table).
The query needs to be able to create this column in the Sales table - it is not available in the source I will be using, only the first 2 columns of this table will be available: ID and Date. What I need to do is figure out how to create the column “minimum difference in dates from this row” (I manually entered these in the Toy Data set)
I have been able to achieve the desired result in Python, so to avoid further confusion, I’ll create a new thread, and also post the python code - perhaps the python logic can be ported to M, alternately someone could point me in the direction of implementing the python code within Power Query - my attempts so far have given me (many) indecipherable errors.
Again, apologies for my poor explanations, and wasting people’s time on this.
Rod
GitHub repo with the working python file and source data: https://github.com/whiteleyrod/MinDifferenceInDatesForGivenID
I’d appreciate any help converting the python to M or implementing the python into the power query. I will keep trying to figure this out, but coding python in the Power Query editor so far seems the work of the devil to me
The attached file is my solution to your question.
let
  Source = Excel.CurrentWorkbook(){[Name = "Sales"]}[Content],
  Type = Table.TransformColumnTypes(Source, {{"ID", type text}, {"Date", type date}}),
  Gp = Table.Group(
    Type,
    {"ID"},
    {
      {"tbl",each
        let
          a = Table.AddIndexColumn(_, "Index", 1, 1),
          b = Table.AddColumn(a,"Min Dif from Current Row", (x) =>
              [
                DateAfter  = [Date]{x[Index]},
                DateBefore = [Date]{x[Index] - 2},
                DiffWithBefore = try x[Date] - DateBefore otherwise null,
                DiffWithAfter  = try DateAfter - x[Date] otherwise null,
                MinDif      = try List.Min({DiffWithBefore, DiffWithAfter}) otherwise null
              ][MinDif]
          )
        in b, type table [ID=nullable text, Date=date, Min Dif from Current Row=nullable duration]
      }
    }
  ),
  Expand = Table.ExpandTableColumn(Gp, "tbl", {"Date", "Min Dif from Current Row"})
in
    Expand
Data-DNA Question.xlsx (18.9 KB)
Hello @rodwhiteley
Did the responses above help solve your query?
If not, can you let us know where you’re stuck and what additional assistance you need?
If it did, please mark the answer as the SOLUTION by clicking the three dots beside Reply and then tick the check box beside SOLUTION
Thank you
Thanks for your help - I can see your query worked in the source data, but for whatever reason it failed when I ported to the “real” data I have.
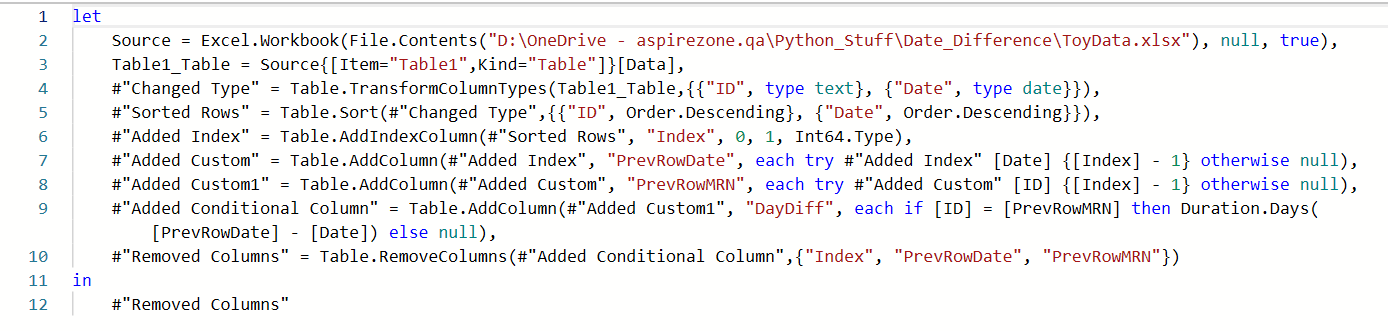
In the interim, I figured out a way to do this in a single query transformation.
Basically the trick was pretty simple: sort the table by ID, and secondary sort by date. This means that adjacent rows will now be the closest dates for any individual ID. I then added an index column, and created some custom columns being the ID for the previous row (PrevRowID), and the Date (PrevRowDate) for the previous row. This allowed me to do a conditional column which returned the difference in the Date field of the current row and the “PrevRowDate” field only for those rows where “ID” was equal to “PrevRowID”.
The rest is then trivial.
Here’s the pbix and the toy data it’s pointing to incase this ever helps anyone else:
Date_Difference.pbix (39.9 KB)
ToyData.xlsx (10.3 KB)
Here’s the query in case you are just looking and don’t want to download the file:
Apologies for my poor explanations,
Rod