I have a set of data from an index of multiple materials, their prices, and their dates. I am trying to figure out how to seperate them within PBI and find their monthly average. I need to be able to change months depending on what my stakeholders need. I have only been working with Power BI for about 2 weeks now and am struggling to figure out which DAX functions to use to correctly portray this info.
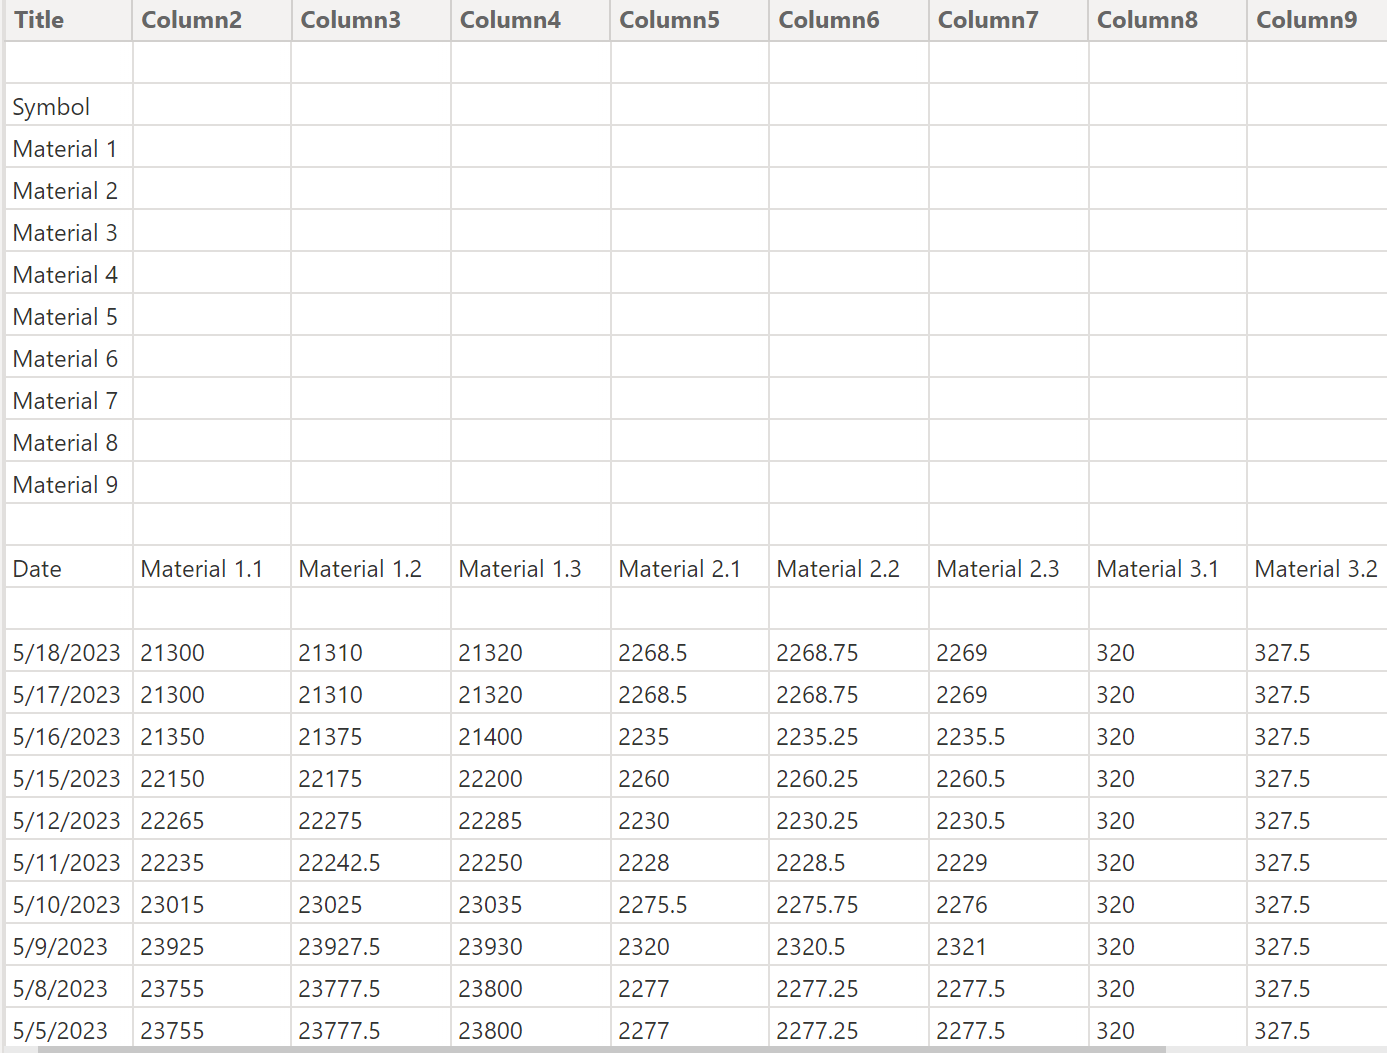
You have material listed as 1,2,3 etc but your data set has 1.1, 1.2, 1.2 etc what are the differences between the two lists?
As for the dates and material prices, you could un pivot that in power query selecting date, and unpivot other columns to create a material price fact table, you would then need to create a date table, there is a great date table in the forum create by EDNA which has a lot of great features, you would then need a distinct list of the materials in a different query for the materials dimension table (thats where the information regarding naming would come in).
In your data model you can create relationships between date and material price, and material and material price, using the month from the date table you can then create an average price per month measure.
Thanks for the response Kylie! I actually forgot to add that table in to this sample pbix, but I did create a table that says what each material is and created the link. Thank you for letting me know about the unpivot function. I am mostly getting stuck on how to create the measure to pick out the specific material and average it.
If you have a materials dimension that has a relationship to the materials price table (fact table) then you would use the material field from the dimension table in the visual, and if it is just the average of the price column, if the material price column is unpivoted, then the material name which was along the top will now be in a column and the price in another column, so through that relationship you should be able to do a simple average as long as it is just the average of the price column.
If you have a date table you can put months along the columns, as long as there is a relationship between date and material price it should work, it will just give the average price in the price column filtered by product and month.
If you want more fancy averages then you will need AVERAGEX which will iterate a table you create perform a calculation and give you the average of that calculation over the table you fed into AVERAGEX.
Sorry you would go to new Measure and create an average measure eg Measure1 = AVERAGE(table name[column name])
We have noticed that your inquiry has remained unresolved for an extended period of time, indicating that it may have been outside the capabilities of our experts and users.
If you believe that you have provided all the necessary context for your concerns and have familiarized yourself with effective forum usage by referring to this guide, we recommend exploring the additional resources included with your subscription. These resources can provide valuable assistance with your Power BI education, and we encourage you to utilize them.
While our users and experts strive to assist with inquiries to the best of their abilities, it is important to acknowledge that not all concerns can be addressed, particularly when there are valuable learning opportunities involved. Thank you for your understanding.
We sincerely hope that you find the solution you are seeking and achieve your desired outcome.