ANSWER:
I provide two approaches below, a calculated column—like you requested—and a measure.
Note, too, you don’t need a relationship between the lookup table column and the target table column to perform cross-table computations.
In the calculated column approach, the formula operates within the row context of the table where the column is added. It processes each row individually, checking against all the keywords in the lookup table. This row-by-row operation doesn’t require a formal relationship because the logic is applied at the individual row level, not across the tables.
The use of SUMX in both the calculated column and the measure allows the formula to “scan” through the lookup table for each value in the main table. SUMX iterates over a table (in this case, the lookup table) and performs the specified calculation (checking if the keyword is contained in the description). This iteration is independent of any formal relationship between the tables.
In scenarios where the relationship between tables is not straightforward or where creating a relationship could overly complicate the data model, these kinds of formulas provide flexibility. They allow for cross-table computations without altering the underlying data model with relationships that might not be needed for other analyses or might introduce unnecessary complexity.
Finally, measures in Power BI are dynamic and calculate results based on the current context, which is defined by filters, slicers, or the specific data points selected in a report. This context-driven calculation allows measures to compare or reference different tables without needing a direct relationship, as they’re not limited to predefined table relationships.
Approach 1: Calculated Column
containsKeyword COL =
VAR CurrentValue = LOWER('Short Description'[Short Description])
RETURN
IF(
    SUMX(
        'Look up Table'
        , IF(
            CONTAINSSTRING(
                CurrentValue
                , LOWER('Look up Table'[Look up Column])
            )
            , 1
            , 0
        )
    ) > 0
    , "Contains Keyword"
    , "Not Found"
)
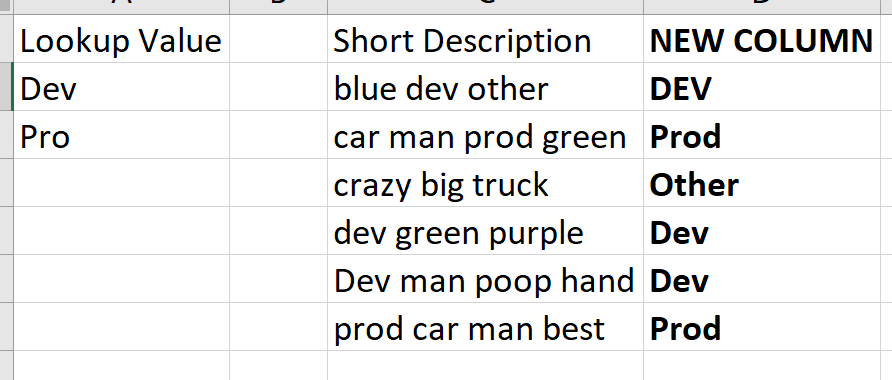
This approach involves adding a new column to your main table (Short Description table). The DAX formula iterates through each row in this table and checks if the Short Description contains any of the keywords listed in the Look up Table.
This method is best when you need a static column that directly shows whether each row contains any of the keywords. It’s particularly useful for creating reports or visuals where this binary indication is needed on a row-by-row basis.
Identifying the keyword is only slightly more complicated:
Identify Keyword COL =
VAR CurrentValue = LOWER('Short Description'[Short Description])
RETURN
    IF(
        SUMX(
            'Look up Table',
            IF(
                CONTAINSSTRING(CurrentValue, LOWER('Look up Table'[Look up Column]))
                , 1
                , 0
            )
        ) > 0
        , CONCATENATEX(
            FILTER(
                'Look up Table',
                CONTAINSSTRING(CurrentValue, LOWER('Look up Table'[Look up Column]))
            )
            , 'Look up Table'[Look up Column]
            , ", "
        )
        , "Not Found"
    )
Approach 2: Measure (containsKeyword Measure)
containsKeyword Measure =
VAR SelectedValue = LOWER(SELECTEDVALUE('Short Description'[Short Description]))
RETURN
IF(
    SUMX(
        'Look up Table'
        , IF(
            CONTAINSSTRING(
                SelectedValue
                , LOWER('Look up Table'[Look up Column])
            )
            , 1
            , 0
        )
    ) > 0
    , "Contains Keyword"
    , "Not Found"
)
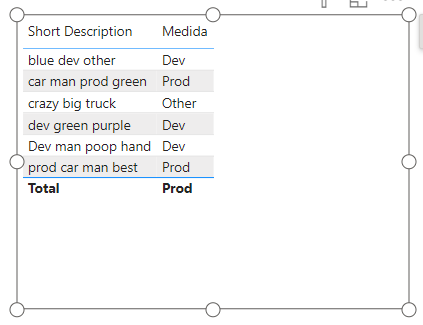
This approach creates a measure that can be used in visuals where the context is defined by the user’s interaction with the report, such as selecting a specific value or filtering.
This approach is ideal for interactive reports where the user might be selecting or filtering specific entries. It allows for a dynamic analysis of whether the selected descriptions contain any of the keywords. The measure works best when a single value from the Short Description is in context. This is particularly important in visuals like tables with multiple rows, where the measure’s behavior might be less intuitive.
And, again, identifying the keyword is only slightly more complicated:
Identify Keyword Measure =
VAR __SelectedValue = LOWER(SELECTEDVALUE('Short Description'[Short Description], "None Selected"))
VAR __result =
    IF(
        __SelectedValue = "None Selected"
        , "Not Found"
        , IF(
            SUMX(
                'Look up Table',
                IF(
                    CONTAINSSTRING(__SelectedValue, LOWER('Look up Table'[Look up Column]))
                    , 1
                    , 0
                )
            ) > 0
            , CONCATENATEX(
                FILTER(
                    'Look up Table',
                    CONTAINSSTRING(__SelectedValue, LOWER('Look up Table'[Look up Column]))
                )
                , 'Look up Table'[Look up Column]
                , ", "
            )
            , "Not Found"
        )
    )
RETURN
IF(HASONEVALUE('Short Description'[Short Description]),__result)
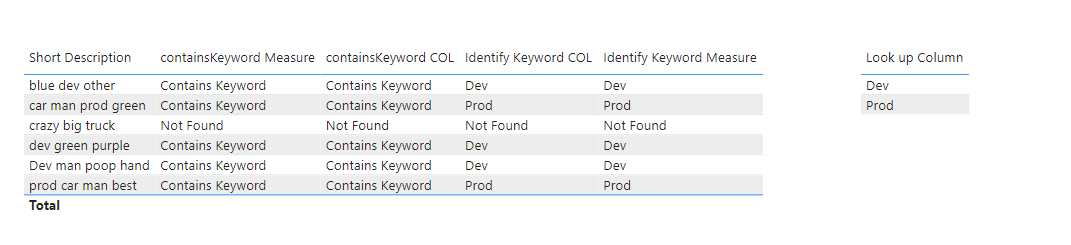
For the measures I added a HASONEVALUE check. that this is used to ensure the measure works correctly in contexts where a single Short Description is selected, as measures can behave unexpectedly in visuals with multiple values.
Is this scalable? I don’t know. This could be computationally intensive especially on large datasets. More attractive alternatives exist if the datasets are large including preprocessing in power query or performing these steps in R or Python.