All:
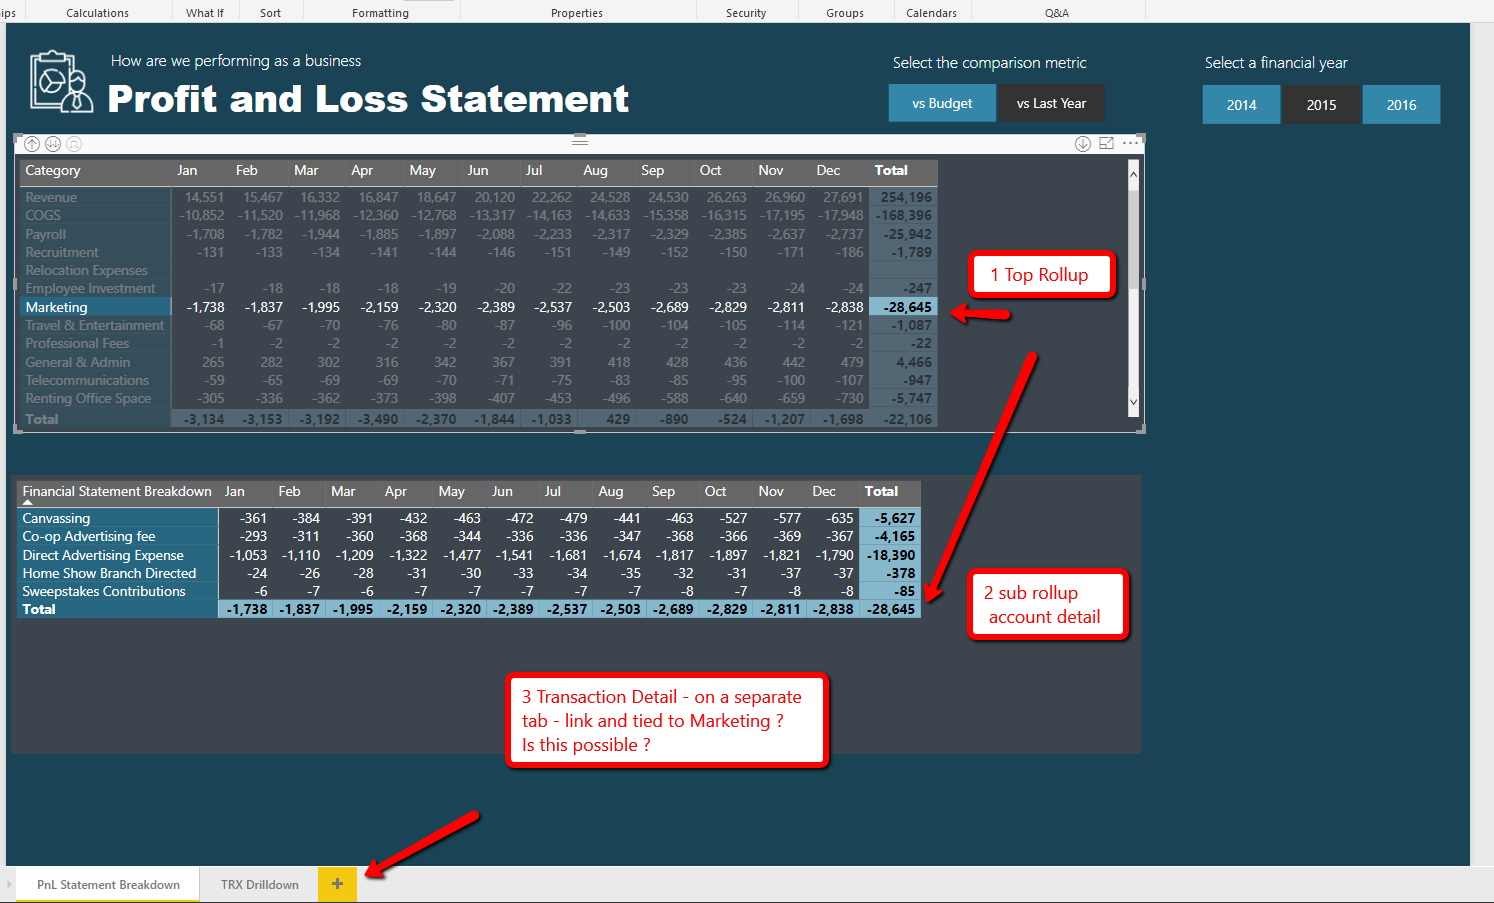
I have been playing around with the Financial Reporting Template that currently drills down to account level detail (trial balance) and am interested if anyone has expanded a similar model to a transactional data granularity. I want to look at a 12 month trend and be able to drill on a selected account down to the transactional level to understand more completely what may have caused a large variance month to month.
I essentially would like to start at the top hierarchy level (Revenue and Expense) - then drill down to the category level - then to the account level - and finally to the transaction level - all synced between visualizations
Theoretically, I believe this is possible - but I am wondering if anyone has done this.
The second part of my question is: Can the transactional drill down be on a separate tab and be synced to the cover page? In the example link above, I would like to select marketing - understand what accounts that make up marketing - then finally drill down to the transactions that make up marketing on a second tab?
If possible, how can the second tab (with transactional detail) be synced to the cover page so that it only returns the transactions for the selected accounts on the cover page?
Thanks,
Dave
