Hi all,
I’m currently working on a P&L overview for a company that has 3 different departments. They want 1 P&L overview with a button to switch between the 3 departments (Verkoop, Verhuur and Service) and the total for these 3.
There are a few sources for this P&L:
- a budget table,
- export from the general ledgers for the monhtly values,
- a seperate table used to divide the overhead costs over the 3 departments based on the revenues from these 3 departments
They want to look at budget, month values, last year values, and this all for current month, YTD and complete year.
Now the issue is, that there are approximaltey 150 rows in this P&L table. And as they want to look at 3 departments and a total, in different ways, i think there will be a lot of measures to make?
150 for montly values dep 1, 150 for YTD values dep 1, 150 for budget values dep 1.
Quit a lot of the values needs a calculation based on general ledgers , combined with a table to divide overhead costs over the 3 departments, so I;m afraid i have to define a lot of individual measures. This is an example of a calculation:
Overige Alg kosten DEP1=
(CALCULATE(SUM(‘Financiele exports’[DebetInPeriode]) ,‘Mapping’[Categorie] = “Overige algemene kosten”) *
CALCULATE(SUM(‘Lonen 2020’[Waarde]) , ‘Lonen 2020’[Idem in % tbv kostenverdeling] = “Verkoop”)) -
(CALCULATE(SUM(‘Financiele exports’[CreditInPeriode]) , ‘Mapping’[Categorie] = “Overige algemene kosten”) *
CALCULATE(SUM(‘Lonen 2020’[Waarde]) , ‘Lonen 2020’[Idem in % tbv kostenverdeling] = “Verkoop”))
In the measure group “Berekeningen Fin Rap Werkelijk” I have calculated all values for the Monthly period for Departement “Verkoop”, but they are not all linked to the P&L statement,
I have also calculated the Budget values for department “Verkoop” and these are already linked to P&L.
I have used a SWITCH (TRUE ()) measure called “Selectie Werkelijk” to Switch between the departments, however this is not working yet for all departments as I;m looking for an effective way to get all measures in.
But I think it would mean i have to copy this measures also for “Verhuur” and “Service”, and then sum them up in another measure to get the total? and then do this for budget, ytd, yearly etc.
Or are there other ways to achieve this? Does anyone have some best practices or examples maybe?
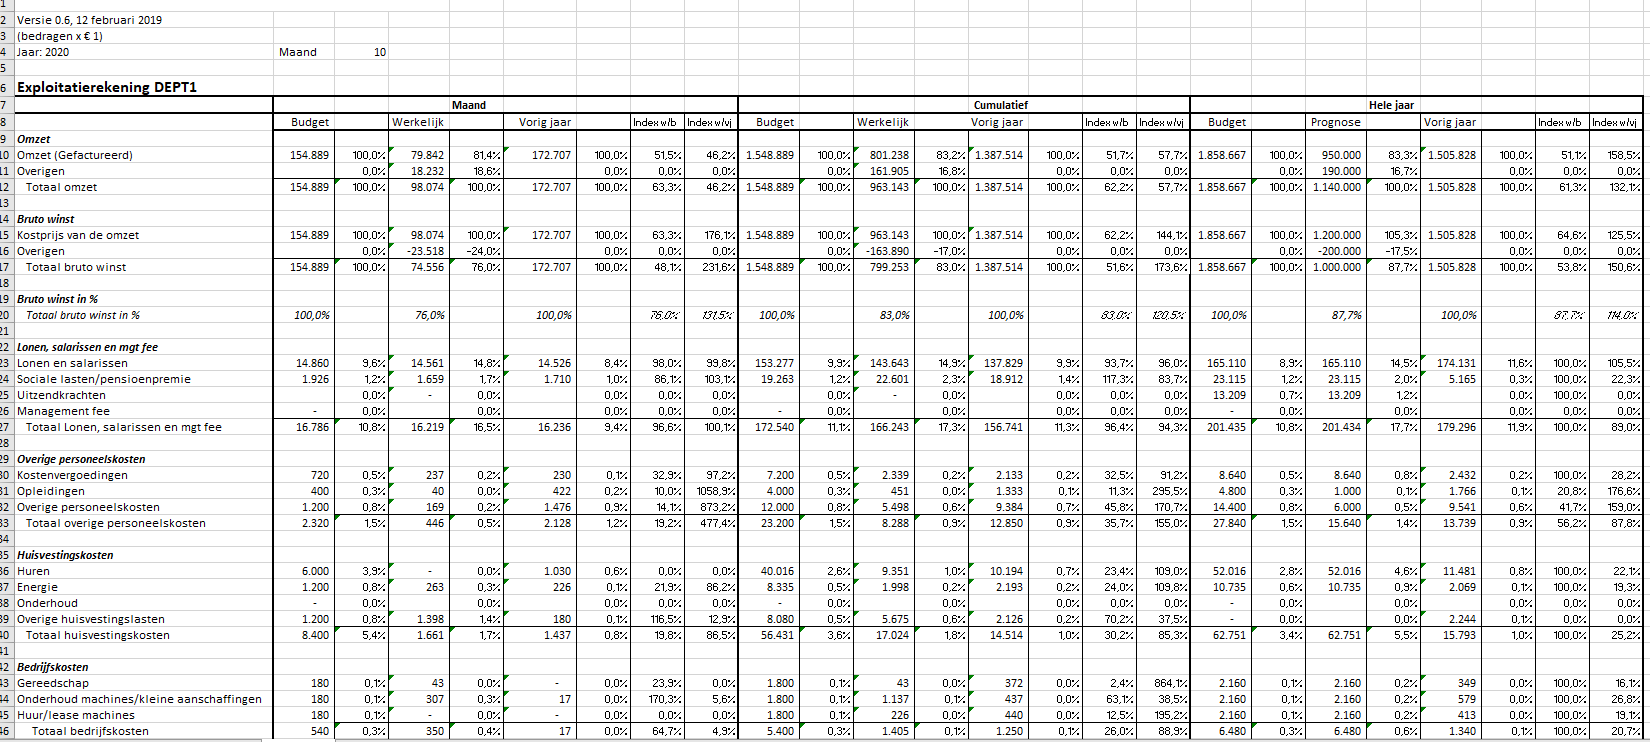
I have attached dummy version of the report so far, datamodel can best been seen on the Financial sheet… I have also attached an exemple of the current Excel file that is used now. this shows only top rows for one of the deparments. So in total there are 4 simular sheets with all calculations from other datatables.
Many thanks for any tips and suggestions…
Regards, Marieke
Financial Report Dummy versie.pbix (450.1 KB)